Configurable crop-cycle monitoring

Crop monitoring table: the full growing cycle in one view

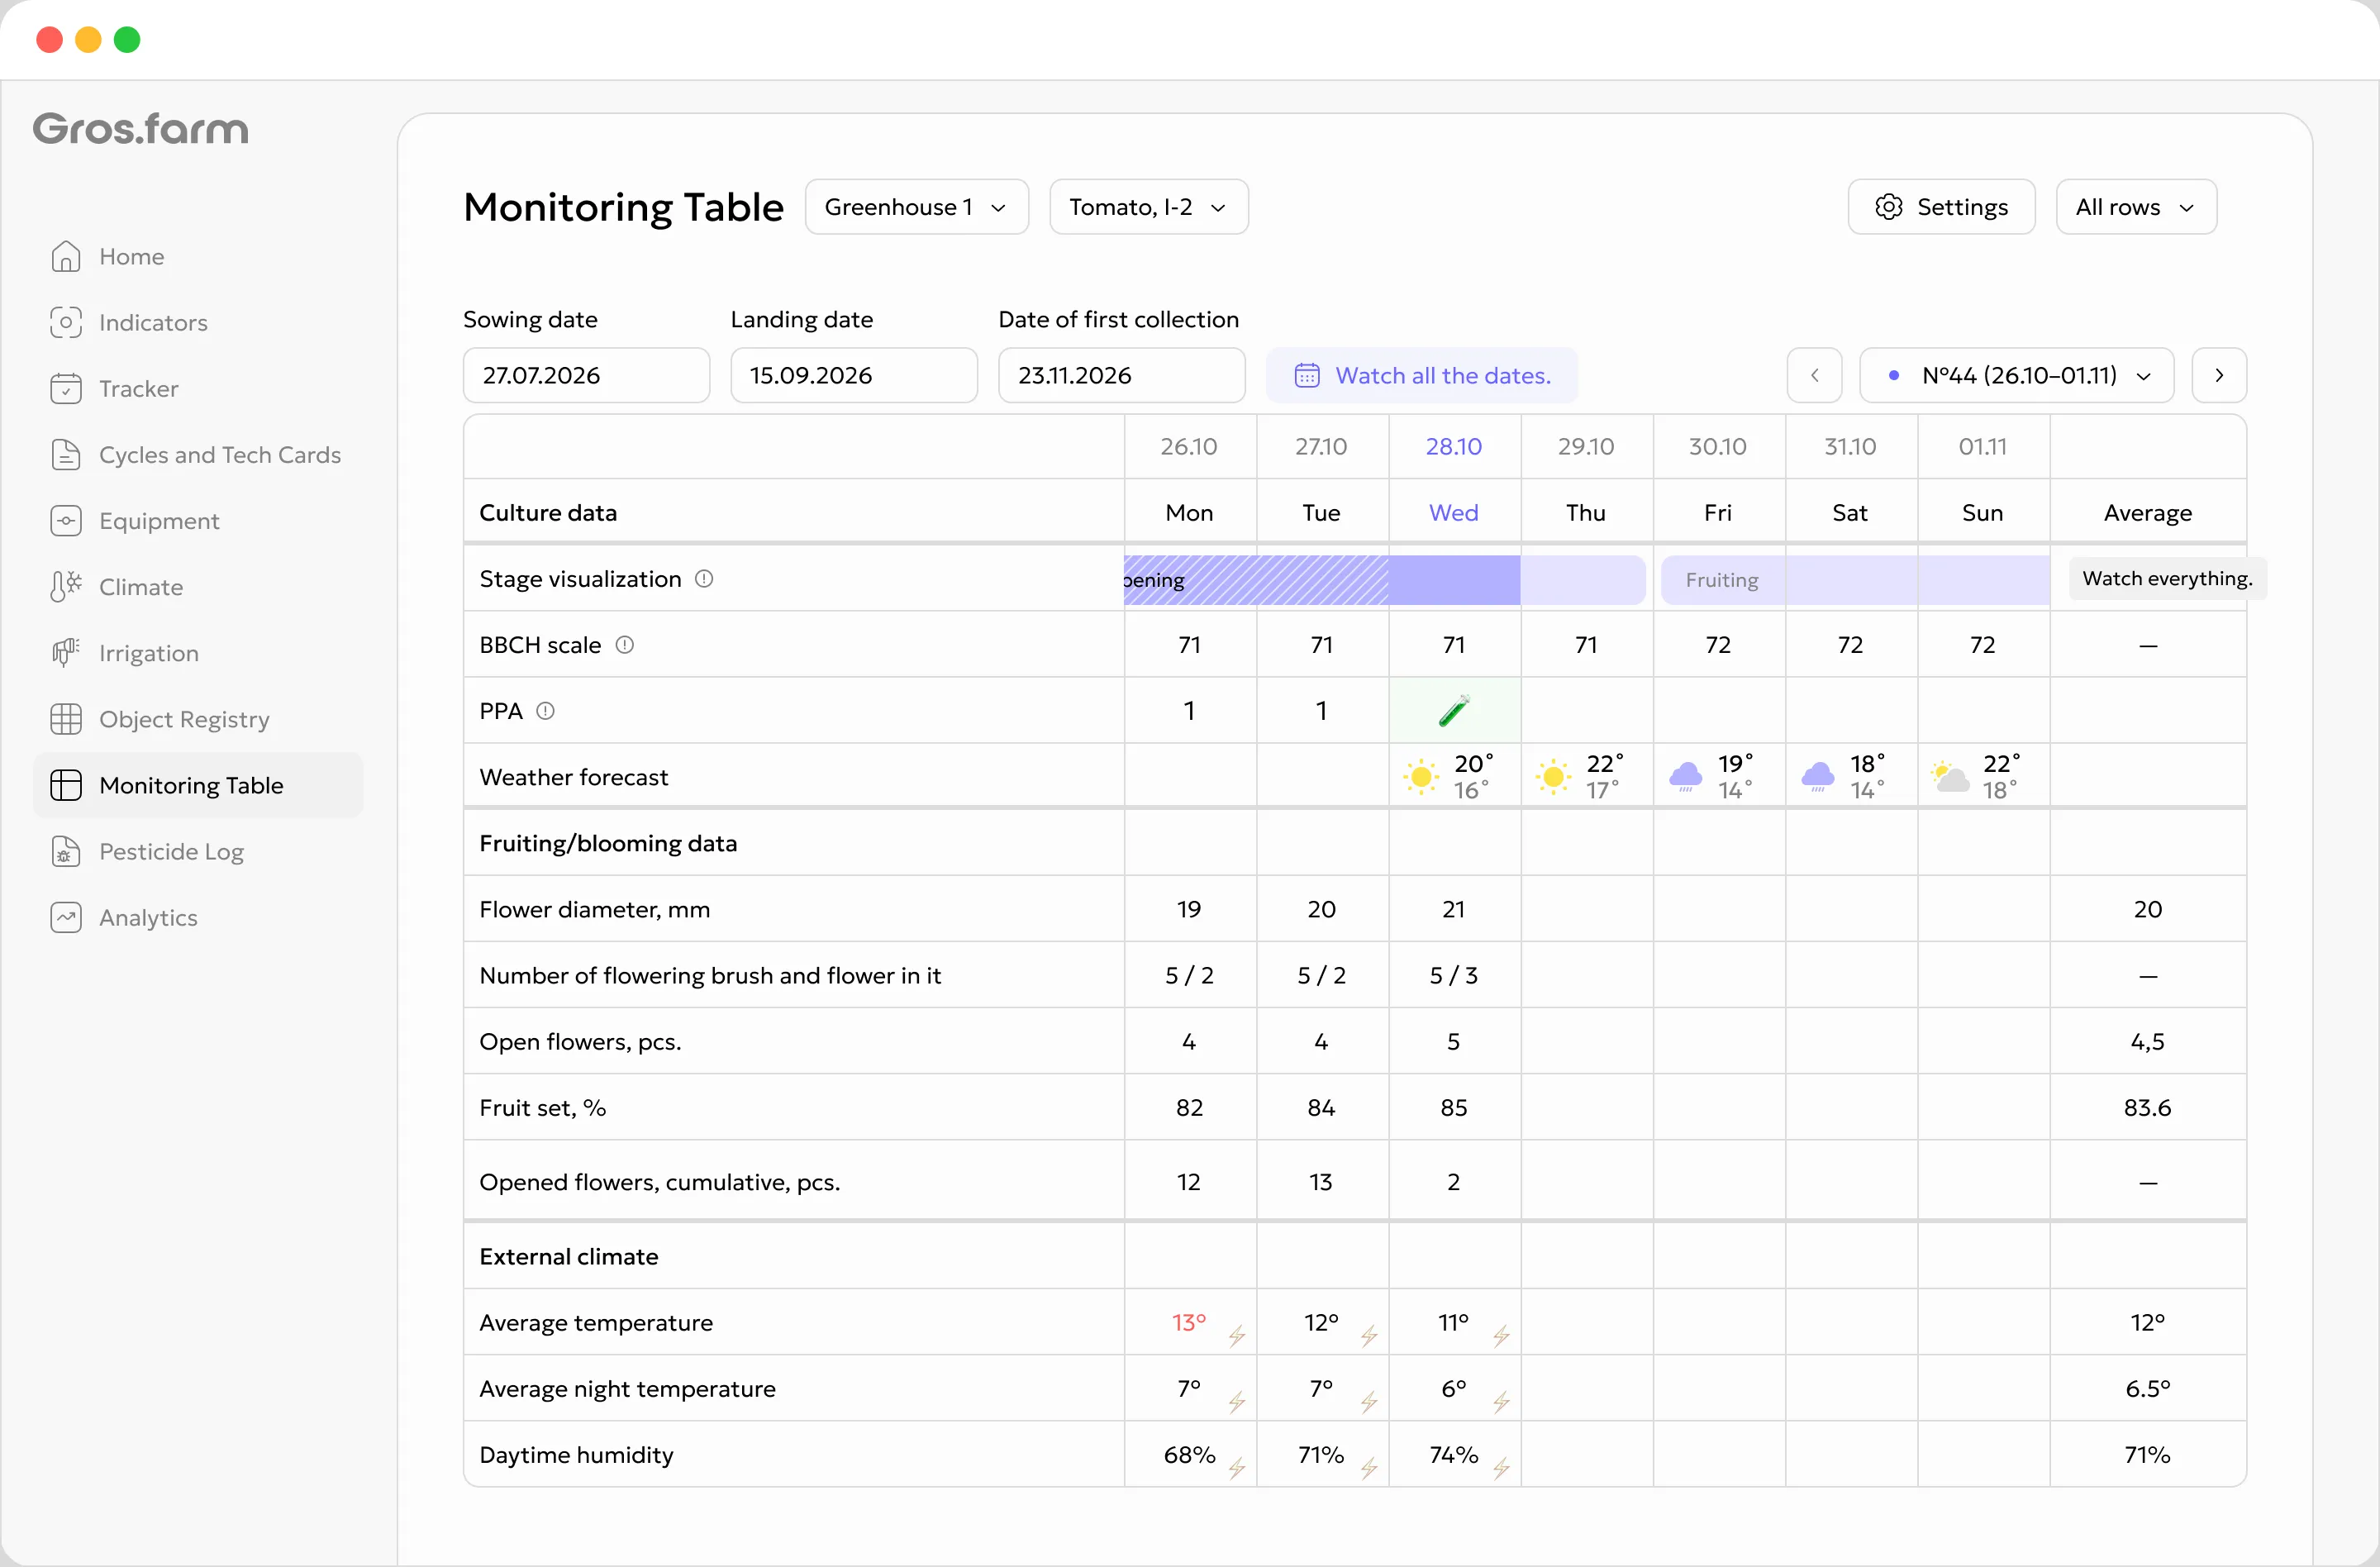
Configure a working view around the crop cycle: choose from 149 built-in parameters, add farm-specific rows and key dates, and keep observations, photos, stages, climate, irrigation, and available sensor data in one chronology.

Try for free
  • 20 types of key production dates
  • Manual, automatic, and calculated values
  • Growing-cycle history for comparison
English Gros.farm crop monitoring table with growing stages, weather, and daily climate values
DataManual · automatic · calculated
AggregationsDay · night · 24 hours
Growth, flowering, and yield
Climate, light, and substrate
Irrigation and resource use
Stages, dates, photos, and weather

Configured around the operation

Decide what the team needs to see in the table

The built-in library covers crop development, flowering, yield, climate, irrigation, and resource use. Add your own rows and keep only the parameters that support the production workflow.

01

Crop biology

What is happening with the crop

Record growth, flowering, fruiting, yield, quality, and visual crop condition.

  • stems, leaves, shoots, and root development
  • flowering, fruit set, harvest, and marketable quality
  • mycelium colonization, pinning, mushroom size, and weight
  • photos, assessments, and specialist comments
02

Environment and resources

The conditions in which the cycle developed

Review crop development together with outdoor and indoor climate, substrate, irrigation, light, and resource use.

  • temperature, humidity, CO₂, VPD, and DPD
  • solution, substrate, irrigation, and drainage
  • radiation, supplemental light, gas, and resource efficiency
03

Cycle context

When and where each record belongs

Key dates, stages, weather, and production location explain each value in the daily chronology.

  • 20 types of dates, from sowing and planting to harvest flushes
  • stage timeline and weather context
  • facility, crop, zone, or production sector
  • farm-specific parameters for the production technology
One interface, different production technologiesEach crop cycle gets the monitoring view it needs

A tomato cycle may track stem growth, leaf area, fruit set, yield, irrigation, and climate. A mushroom cycle may track mycelium colonization, pinning, mushroom size and weight, substrate conditions, and grow-room climate. The team sees the working set for the cycle, not the full catalog.

How the table is populated

The team records some data; connected sources provide the rest

Manual observations, connected measurements, and calculated parameters appear side by side. The source of each value remains clear.

MANUAL

Manual observations

Phenology, morphology, yield, product quality, photos, and specialist comments.

Start without sensors or automation
AUTO

Automatic values

Climate, light, substrate, irrigation, drainage, and weather data from connected sources, aggregated by day, night, or 24 hours.

No manual transfer when a source is connected
CALC

Calculated metrics

Growth rate, leaf area and LAI, drainage percentage, water use, and light-use efficiency.

Calculated when the required source data is available
Start without sensors

Select the parameters you need, record observations manually, and attach photos. Add automatic sources later when they solve a defined production need.

English Gros.farm intraday chart opened from the crop monitoring table

From daily value to intraday detail

Look beyond the daily average when the pattern matters

Open an available automatic value to inspect its intraday chart. See when a rise began, how long a peak lasted, and when the metric returned to its usual range.

Why this matters

Two days with the same average may have very different peaks, ranges, and duration of deviation.

History and comparison

Compare the current cycle with previous cycles

Farm history remains available after the cycle. Revisit the same crop from a previous season and see where the current trajectory follows a successful cycle and where it diverges.

Compare equivalent biological stages

For plants, align observations by development stage and BBCH code; for mushrooms, use the production stage. Compare flowering with flowering, not simply July with July.

See several cycles across a facility

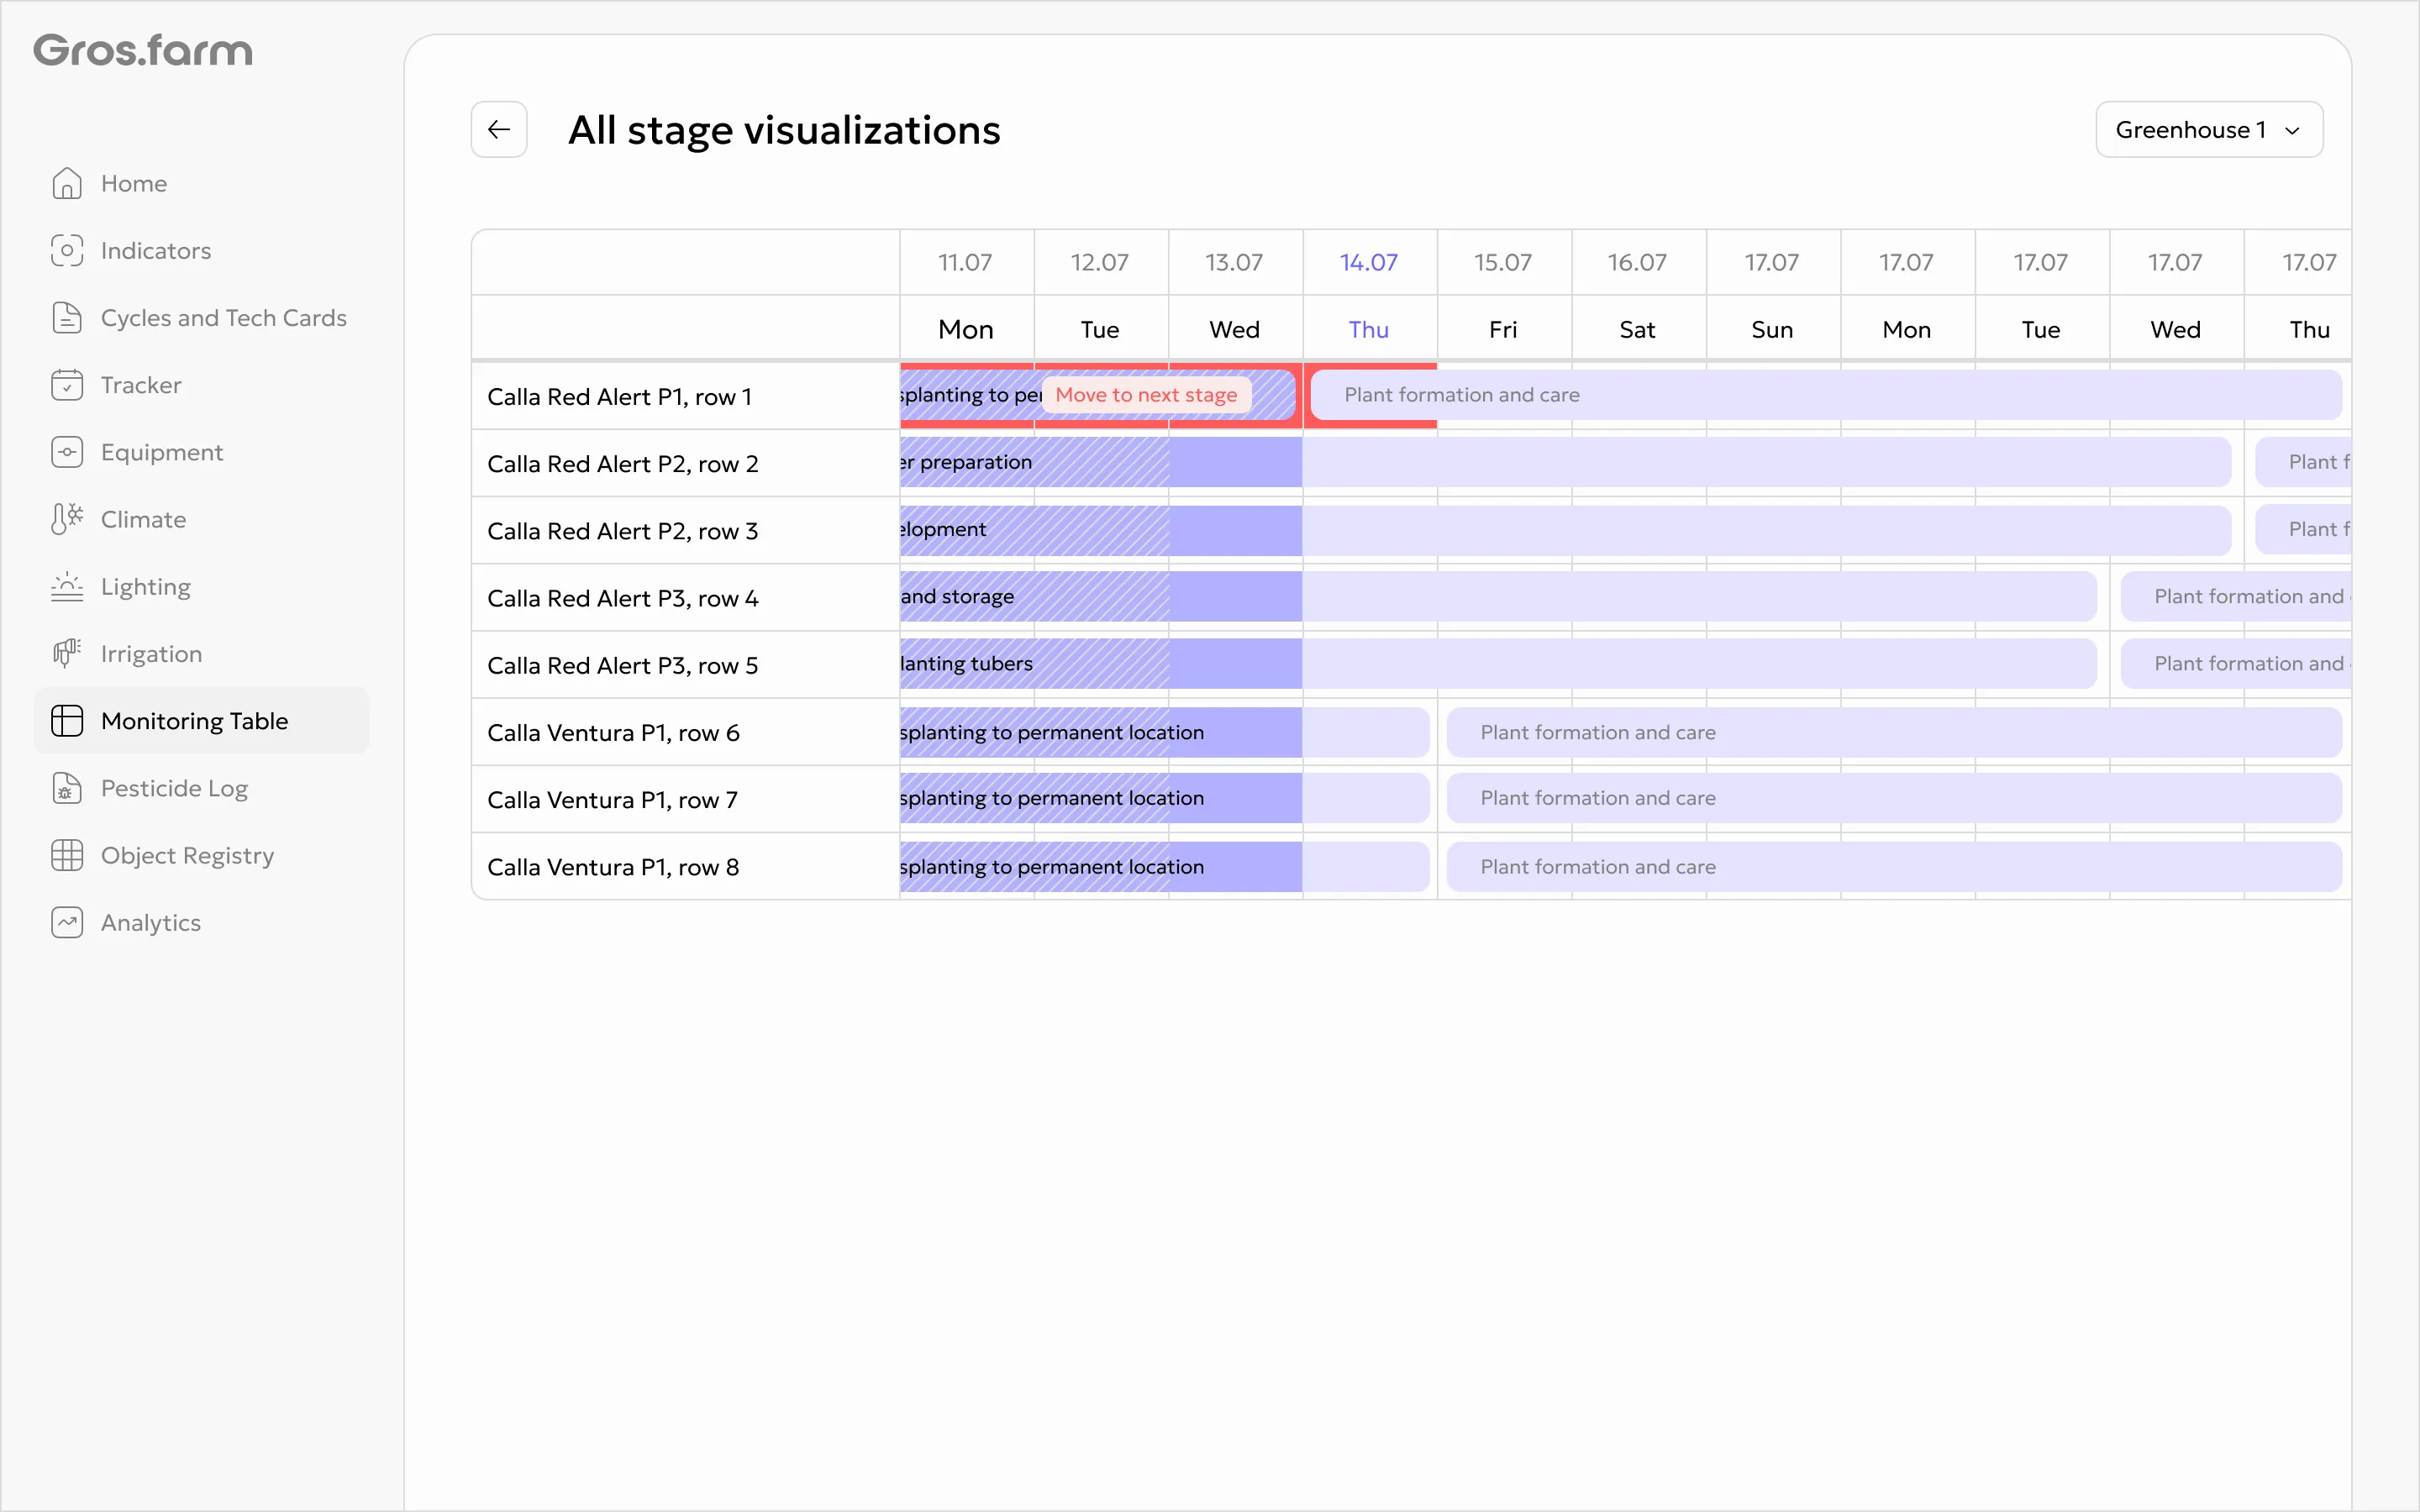
Review zones, current stages, and timing together to see what is on plan and where a transition is beginning to slip.

Facility overviewAll growing cycles
Current stages
Tomato · MerliceGreenhouse 1 · row 04
NurseryEstablishmentFloweringFruiting
Flowering · day 6
Button mushroom · A15Grow room 3
ColonizationCoolingPinningHarvest
Cooling · day 2
Strawberry · AlbionTunnel 2
VegetativeFloweringFruitingHarvest
Fruiting · on plan
Lettuce · AficionVertical farm · level 5
GerminationNurseryGrowthHarvest
Bulking · 1 day late
CompletedCurrent stageNext

Context for people and AI

History across cycles turns records into farm knowledge

When crop, zone, stage, dates, observations, and growing conditions share one daily chronology, the current cycle can be compared with past and parallel cycles. That context supports both specialist review and connected AI tools.

For the team

See what changed and when

A specialist reviews crop development together with conditions and production events.

  • compare matching stages and BBCH codes
  • identify the day the trajectory began to diverge
  • retain production experience between seasons
AI workspace

Context for a specific growing cycle

A model works with cycle history, growing conditions, and production events, rather than an isolated number.

  • compare the current trajectory with previous cycles
  • surface recurring deviations and missing records
  • formulate hypotheses and questions for specialist review

Crop monitoring questions

What to know before you start

What is the Gros.farm crop monitoring table?

It is a configurable working view and daily log for an active growing cycle. Select the rows you need, and Gros.farm connects them by date with observations, photos, key dates, stages, and available automatic data.

How many built-in parameters are available?

Gros.farm provides 149 built-in parameters: 69 for crop growth, flowering, fruiting, yield, and photo records, plus 80 for climate, irrigation, light, substrate, and energy. There are also 20 types of key dates, a stage timeline, weather context, and custom parameters. Each monitoring table includes only the rows selected for that cycle.

Can monitoring start without sensors?

Yes. Begin with manual observations, photos, comments, key dates, and growing stages. Add sensors and local automation later when they support a defined production task.

Which parameters can be monitored?

For plants, track growth, leaves, roots, flowering, fruiting, yield, and product quality. For mushrooms, track mycelium colonization, pinning, size, and weight. The same chronology can also include climate, light, irrigation, solution, substrate, drainage, weather, resource use, and farm-specific parameters.

How does the table support the AI workspace?

Structured cycle history gives a connected model context such as crop, facility, stage, metrics, and events. The model can help compare facts, identify missing records, and formulate hypotheses for review. Assessment and decisions remain with the responsible production specialist.

Can we revisit previous growing cycles?

Yes. Observation, parameter, date, and growing-condition history remains available. Open a previous cycle of the same crop and compare it with the current cycle at an equivalent stage or BBCH code.

Can several cycles be reviewed together?

Yes. A facility overview can show several cycles, their production zones, current stages, and timing. This helps identify delayed transitions and plan team work or harvest.
Build the monitoring view your operation needs

See the growing cycle as a whole

Select relevant rows from the built-in library, add farm-specific parameters, and begin with the data your team already has.

Try for free