Metrics, monitoring, and analytics
Gros.farm provides three connected but distinct ways to work with data.
Metrics
Metrics show the current or historical value of a specific parameter. Data can be entered manually, received from sensors, local automation, or external services, or calculated by the system.
Examples include air temperature and humidity, substrate temperature, CO2, VPD, DPD, illuminance, and solar radiation.
Monitoring table
The monitoring table is a daily journal for a growing cycle. It brings plant observations, manual entries, photos, comments, automatic climate values, and calculated metrics together in one place.
Learn more: Monitoring table.
Analytics
Analytics is used to compare several time series and investigate changes over a selected period. A chart can combine metrics, target ranges from the cultivation plan, and production events such as a transition to a new stage.
Target ranges
Targets for the current stage help identify when an actual value is outside the planned range. A value outside the range is a signal for analysis, not a ready-made agronomic diagnosis.
The quality of the result depends on correctly configured data sources, units of measurement, and the metric’s connection to the correct facility or section.
Solar radiation sum
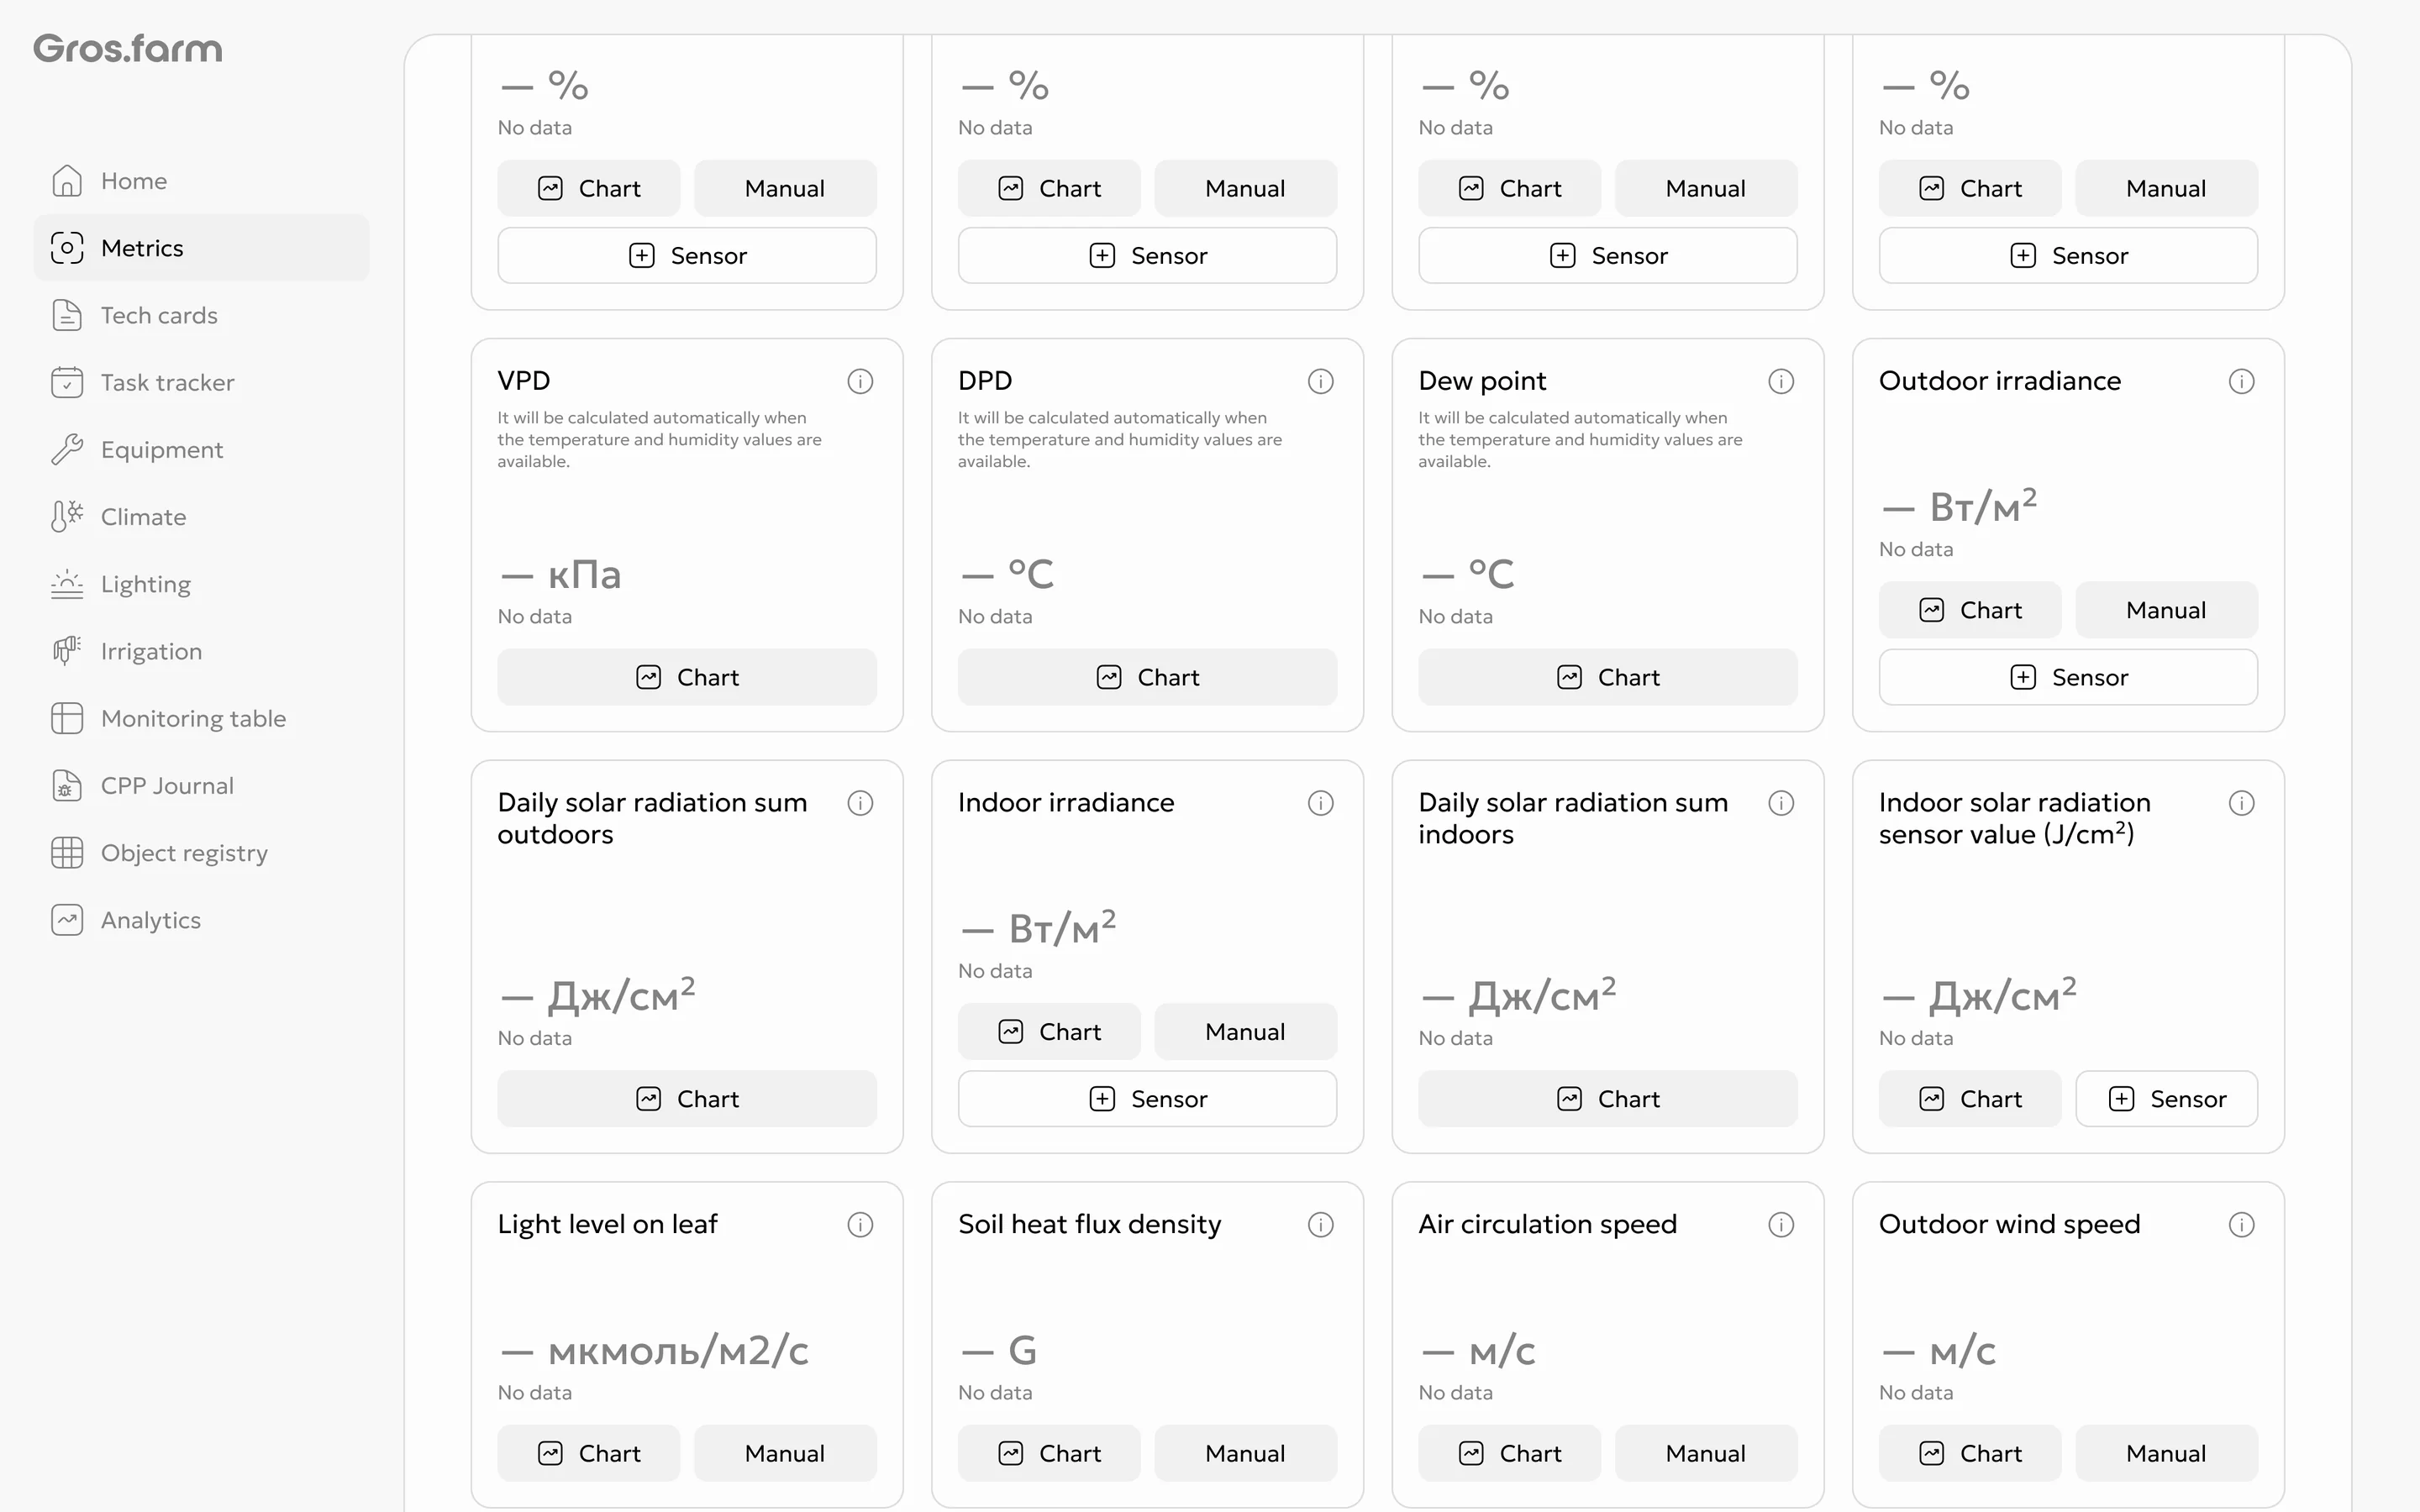
Outdoor and indoor locations each have two different metrics measured in J/cm²:
- Solar radiation sum for the light day — the final calculated metric;
- Solar radiation sum sensor value — the raw accumulated reading from a physical sensor.
The final sum remains the primary metric for analysis and automation. When an accumulating sensor is connected, the system calculates the result from changes in the primary sensor’s readings and accounts for resets. Without that sensor, the result is calculated from irradiance data. The light-day boundaries come from the facility’s sunrise and sunset settings.
The raw sensor value is intended for equipment diagnostics. It can reset during the day and therefore does not replace the final sum. The final and raw metrics have separate charts, and neither supports manual entry.
Learn more: Connect a sensor to a metric.