Plant and growing conditions monitoring table

Keep observation history by objects, crops and zones: manual parameters, microclimate, weather forecast, treatments and growing stages in one place.

Try for free
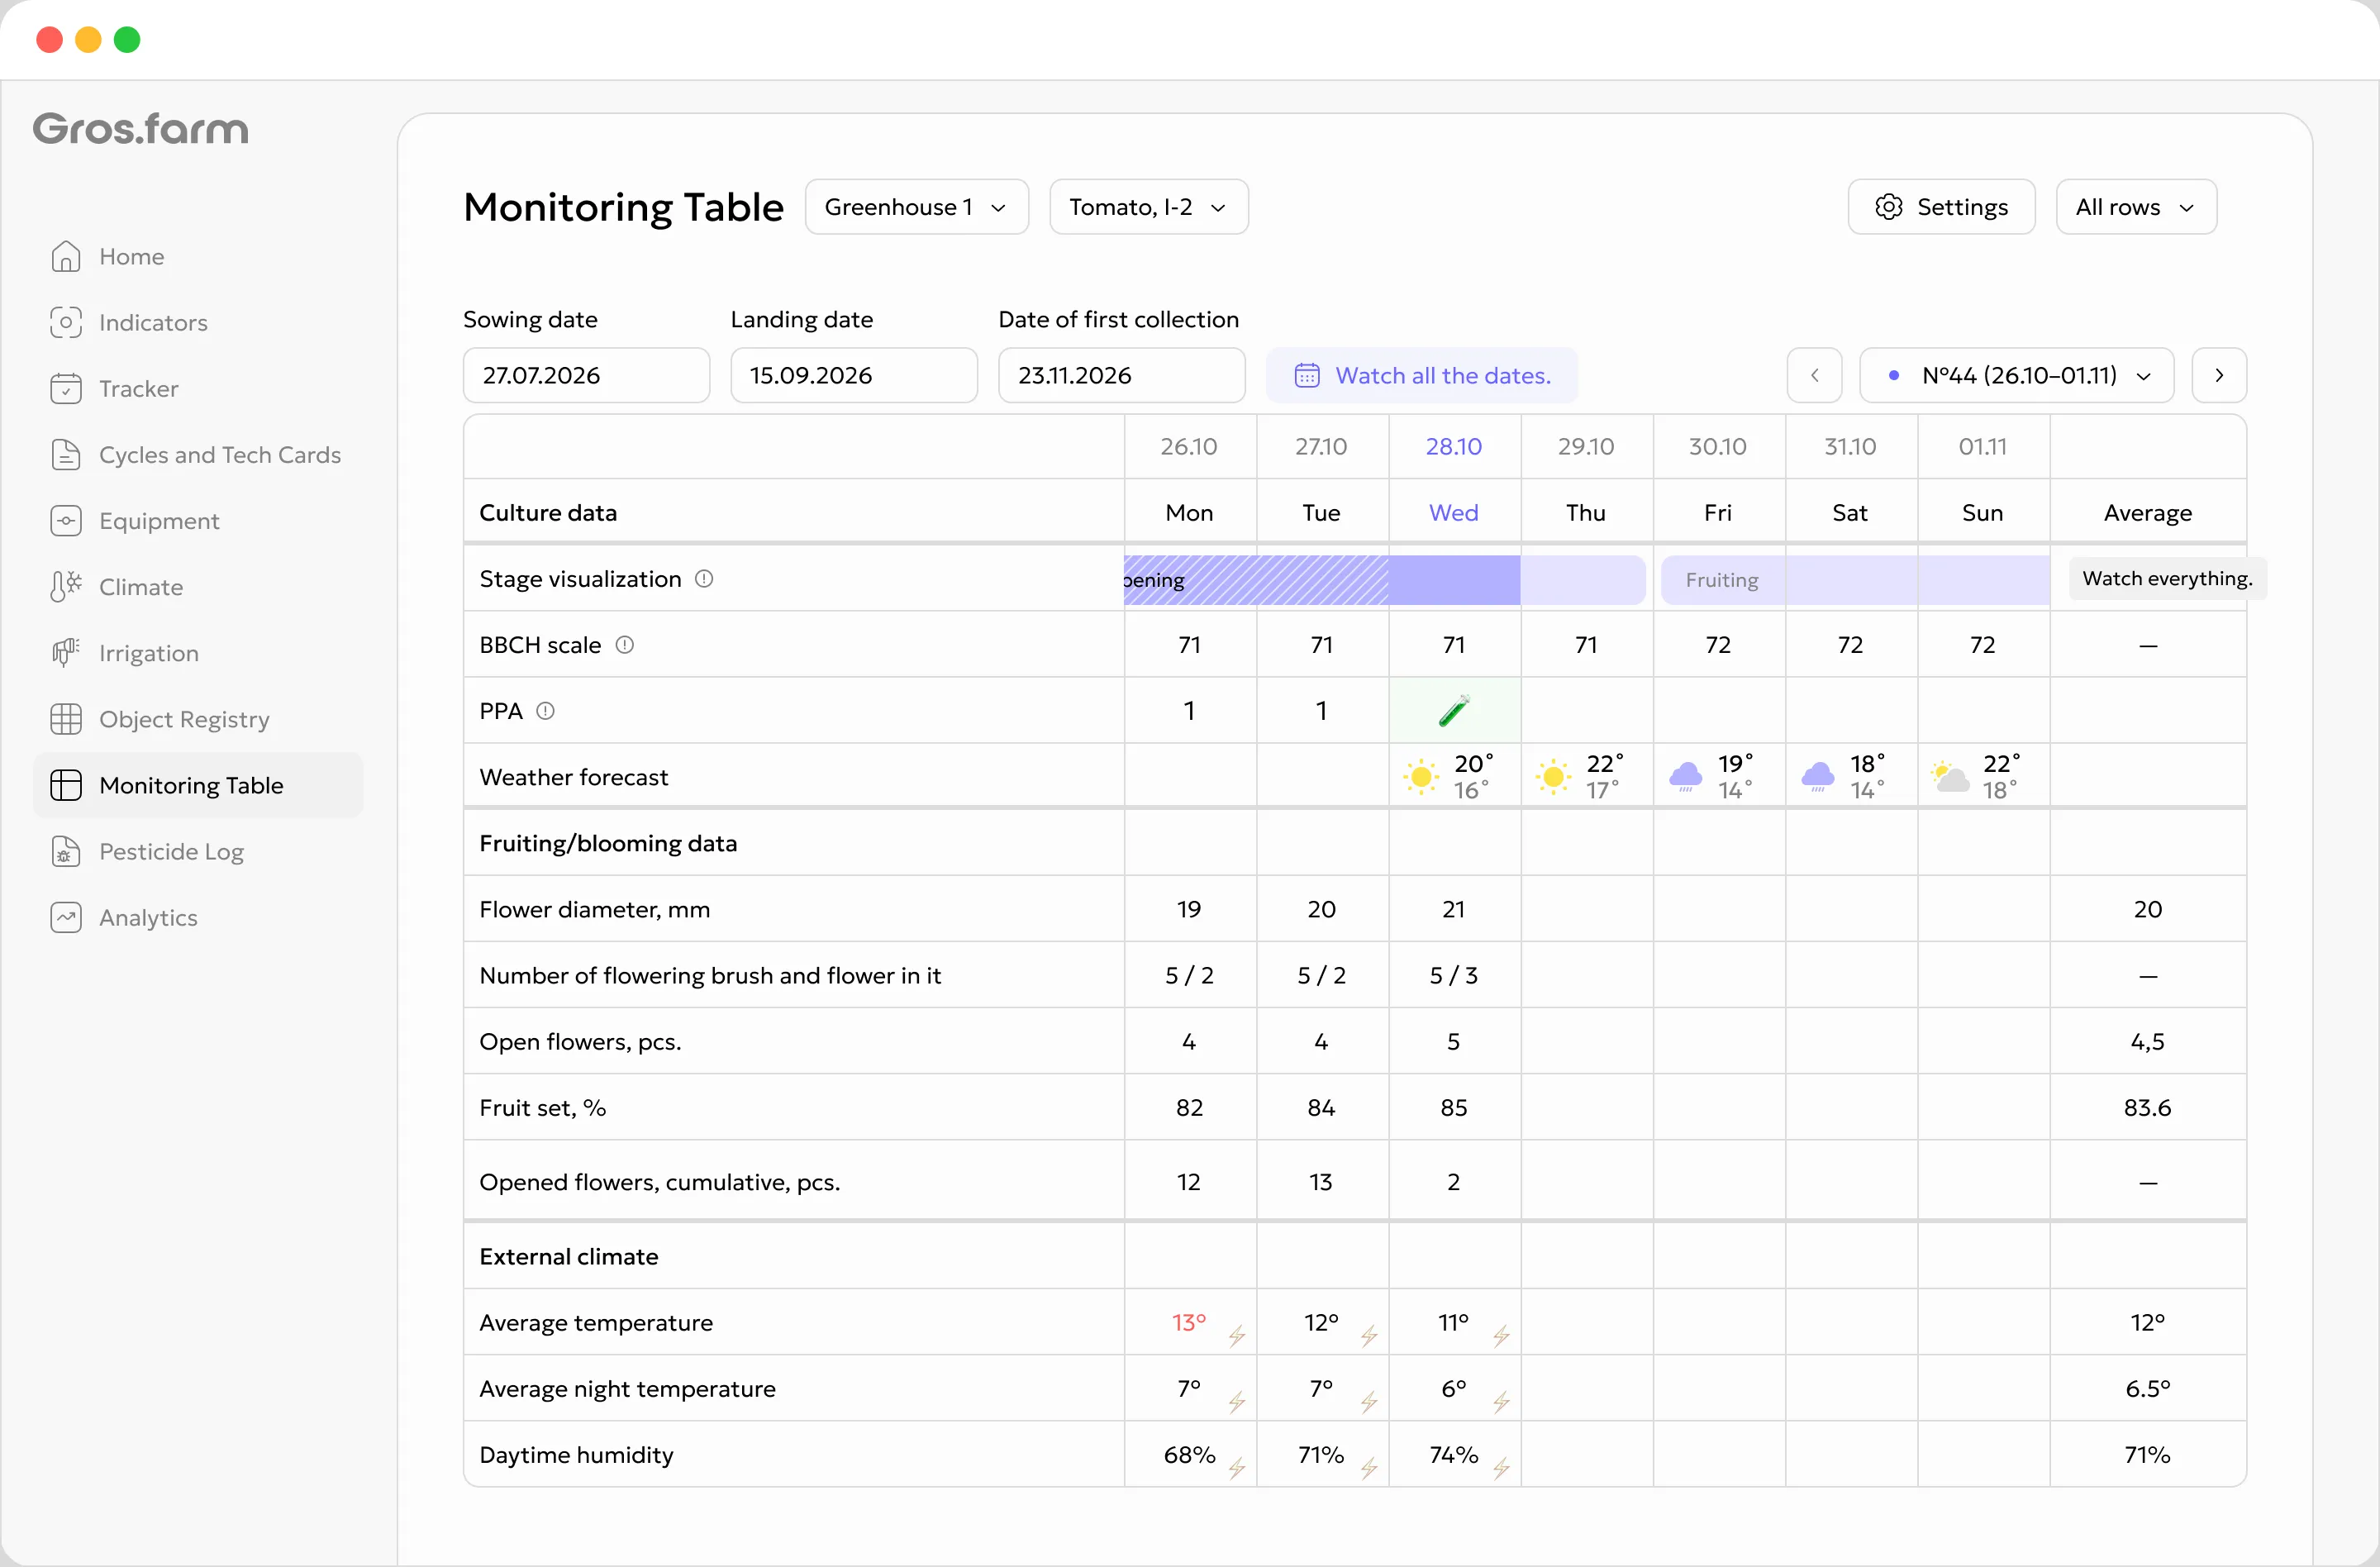
Screenshot of the Gros.farm monitoring table

Observations, climate and stages meet in one table

The monitoring table is not limited to sensor data. It brings together manual observations, microclimate indicators, external services, growing stages and completed treatments so the crop history is readable as a whole.

Manual observations

Record parameters that cannot be captured automatically: plant condition, flower size, number of leaves, stem height and other signs.

Microclimate and metrics

View temperature, humidity, CO2, light and other parameters that affect crop development.

Forecast and weather services

Use external conditions, forecast and weather service data to explain changes by object or zone.

Tech cards

Connect observations with growing stages, norms and production context.

Treatments and crop protection

Record completed treatments and return to them when reviewing plant condition.

Growing stages

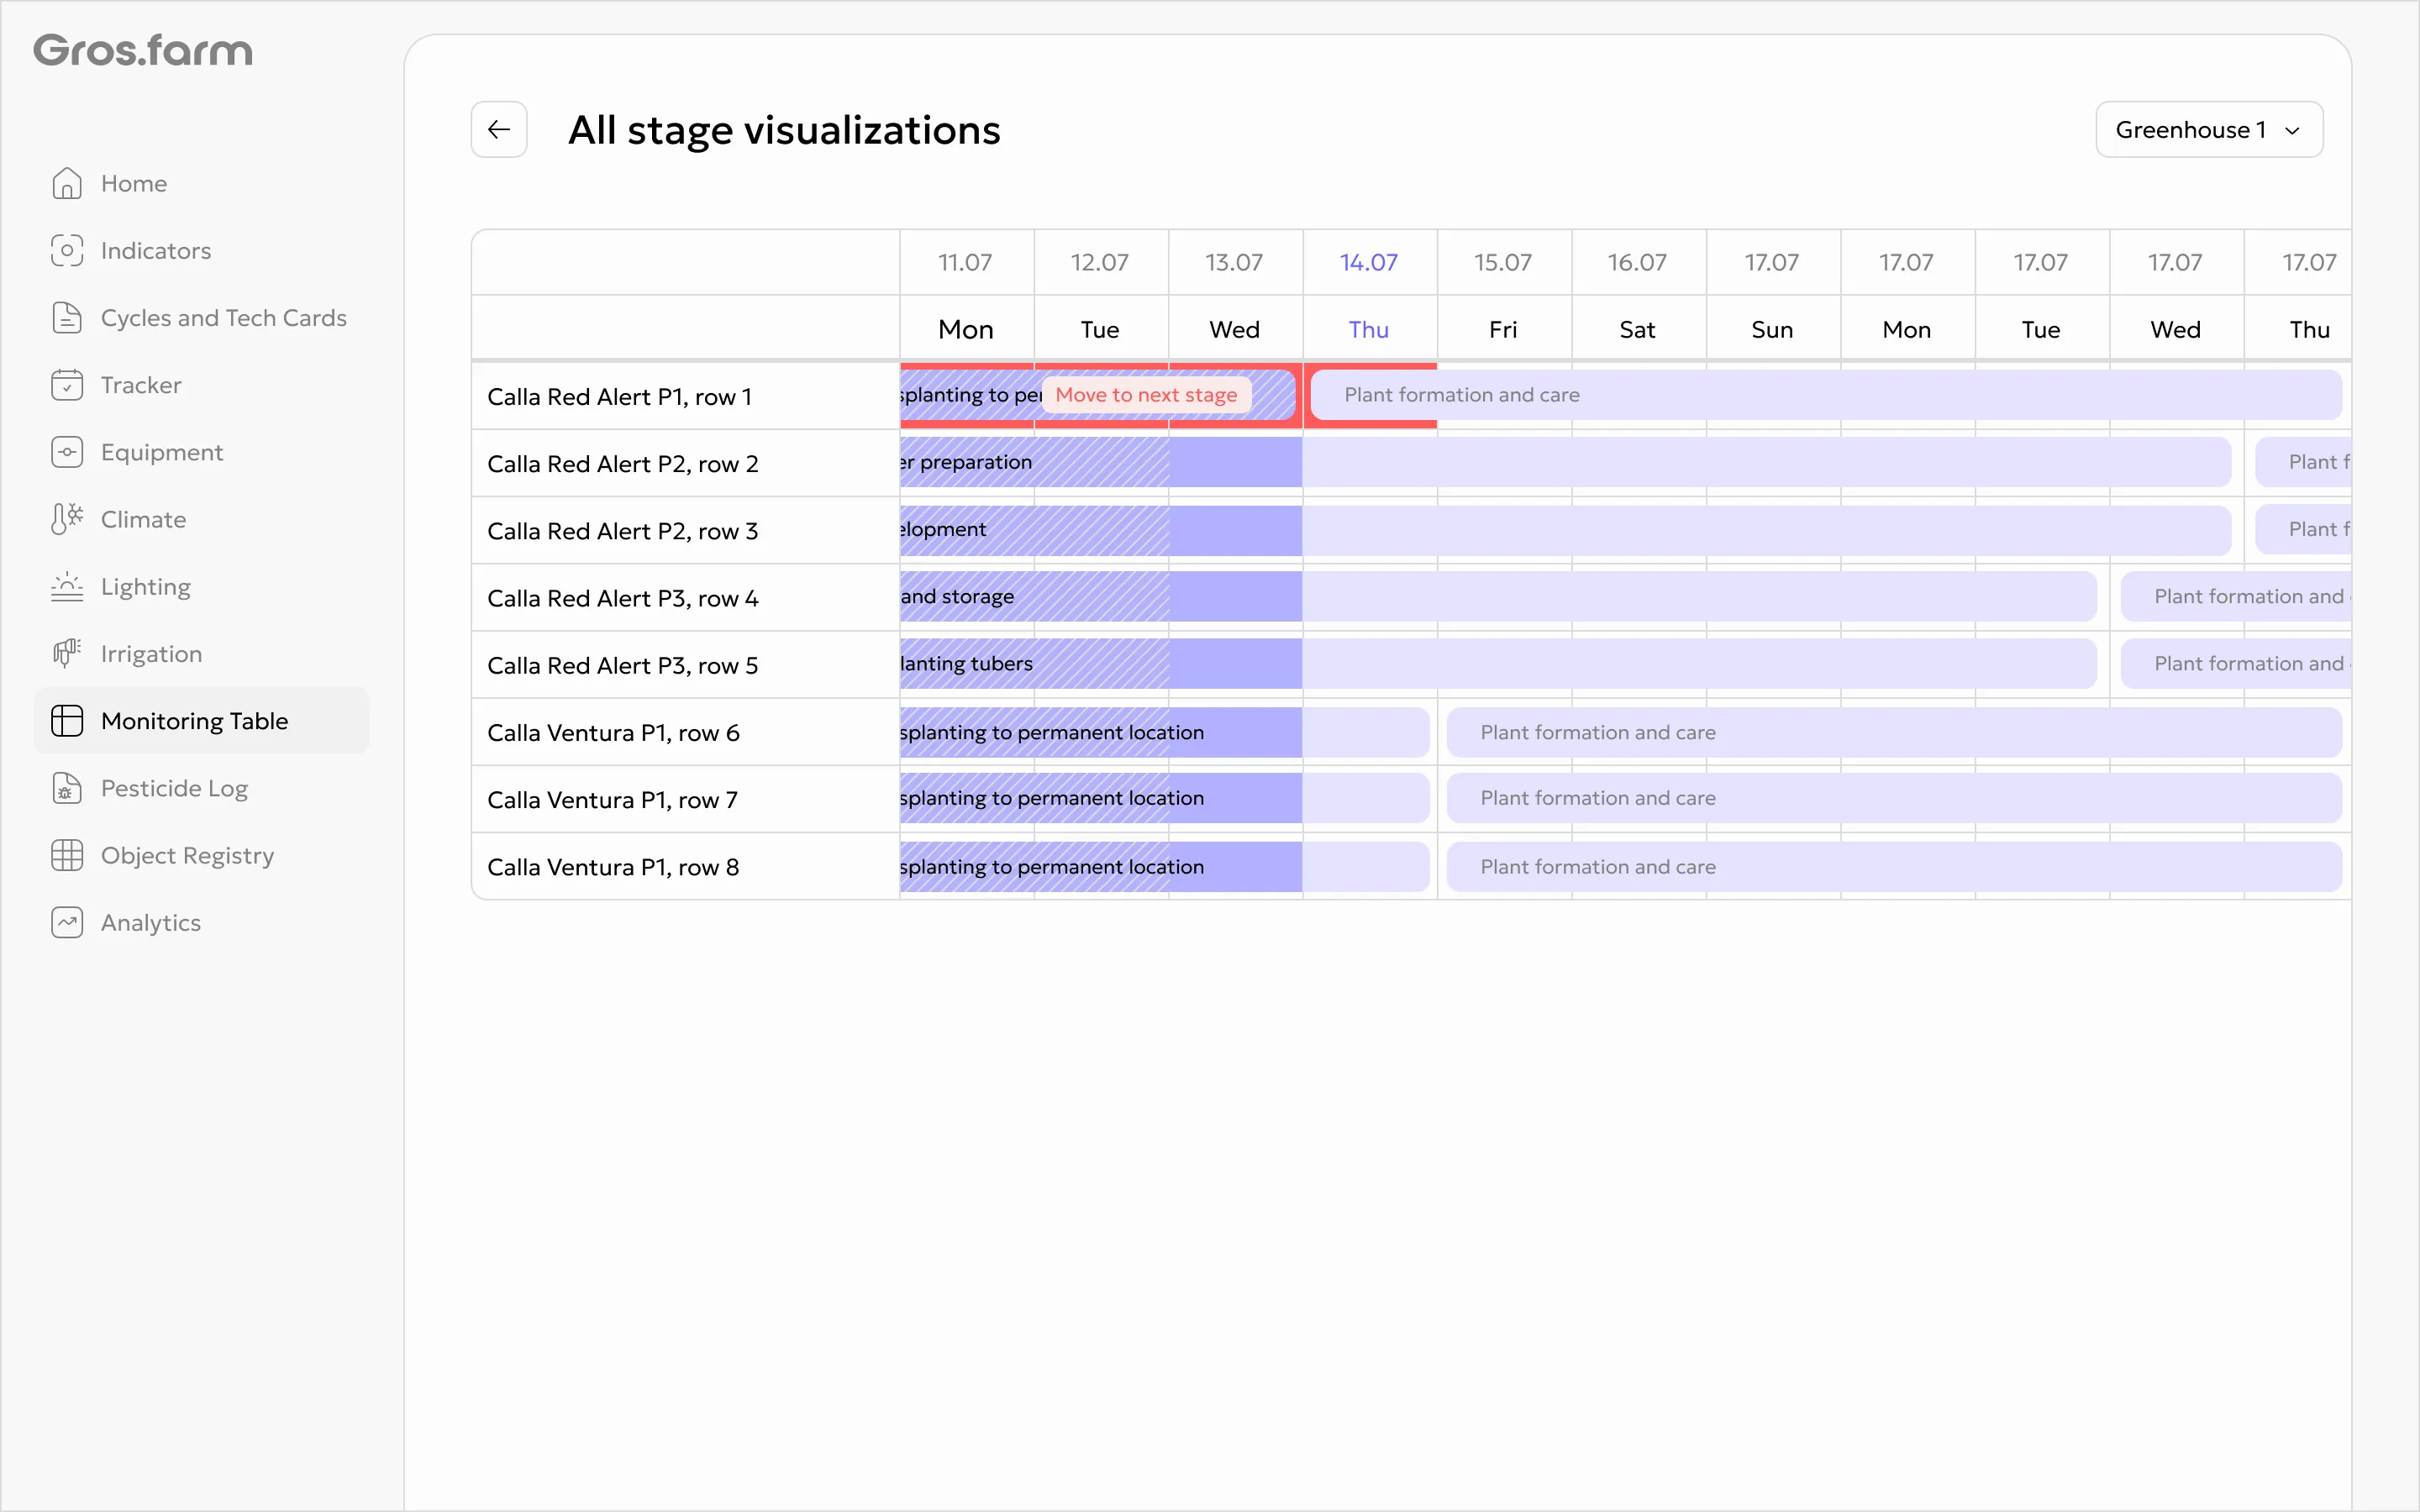
Read metrics next to the current stage: the same value can be normal or a deviation at different periods.

Dynamics are visible for the whole object and for separate zones

Filters by weeks, crops and zones help compare sections, rows, chambers, racks or other parts of the object. You see the overall farm picture and separately check zones where dynamics differ.

  • Compare zones with each other
  • View history for a week, cycle or selected period
  • Separate overall object dynamics from local deviations
  • Return to data after the growing cycle is complete
Screenshot of indicator charts and dynamics in Gros.farm

How the monitoring table connects with other sections

The table stores observation history. Related sections help explain context: where the zone is, which norms apply, what has already been done and where deviations need review.

Monitoring table

Working observation history by object, crop, zone, growing stage and treatments.

Metrics

Show the current state: value, data source, update time and a quick chart for a separate parameter.

Analytics

Helps compare time series, events, norms and deviations more deeply for a selected period.

Tech cards

Norms, stages and growing plans that help check table records against the technology.

Object registry

Object structure: zones, sections, chambers, rows and racks connected with observations.

Task tracker

Work based on observations: who is assigned, what is done and where action is needed.

History helps with reporting and season review

Data stays available in the table and charts: you can review a period, compare zones and return to decisions after the cycle is complete.

Period

History for a week, cycle or selected range.

Zone comparison

Check where conditions and development differed from the overall picture.

Season review

Use the history of observations, treatments and metrics for future decisions.

Frequently asked questions

How is the monitoring table different from a regular table?

A regular table stores rows and values. In Gros.farm, data is connected with an object, crop, zone, period, growing stage and data sources.

Can the table be used without sensors?

Yes. Sensors can be one data source, but the table also works with manual input, weather forecast, tech cards and completed treatments.

Who is the monitoring table for?

For greenhouses, mushroom farms, berry farms, flowers and open field production when observations need to be tracked by crop, zone and period.

Can data be used for reporting?

Yes. The table and charts show observation, treatment and metric history for the selected period.

Can I add my own parameters?

Yes. Along with ready-made parameters, you can add your own: flower size, number of leaves, stem height, soil moisture and other observations important for the farm.

Can I view data by zones?

Yes. Data can be filtered by zones, crops and periods to compare the whole object and separate sections, chambers, rows or racks.

Does the table replace analytics?

No. The table is for working history of observations and parameters. Analytics is for deeper comparison of series, events, norms and deviations.

Collect growing history in one place

Gros.farm helps keep observations, metrics, zones, stages and treatments as part of one production process, not as scattered notes.

Try for free