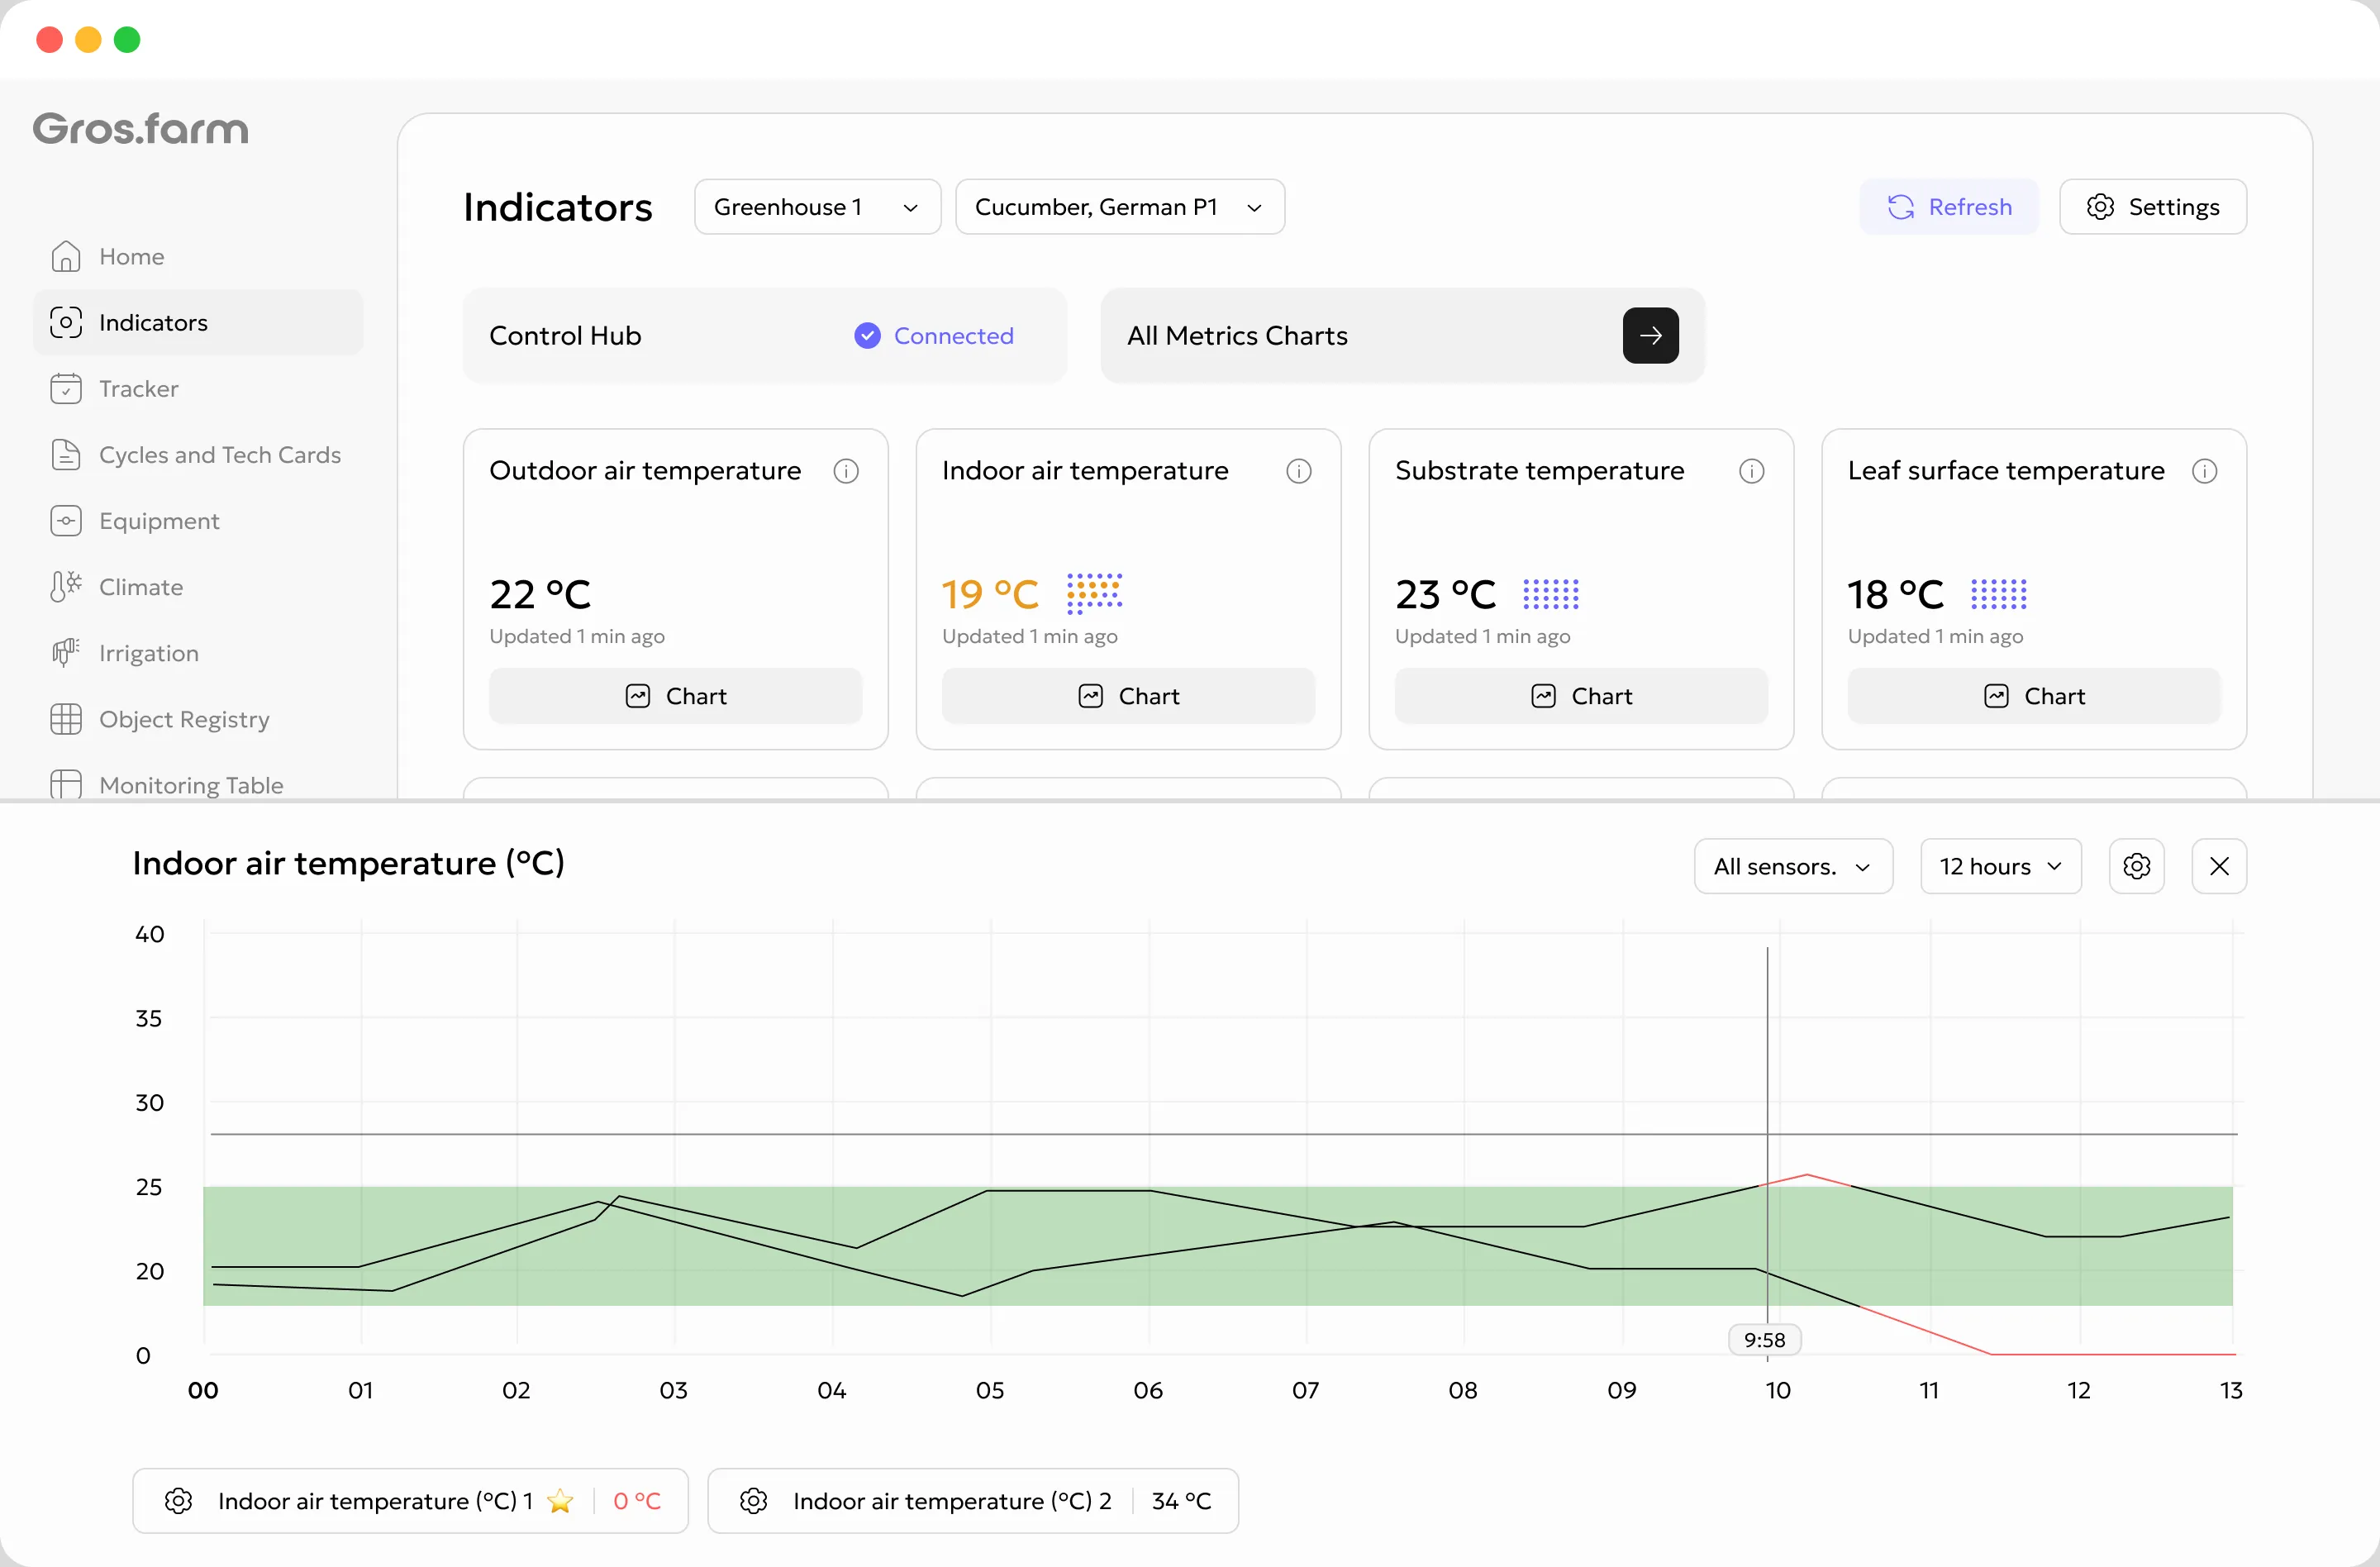
01 · MetricsWhat is happening now?
Indoor relative humidity68%
Updated 2 minutes ago- current value and unit;
- update time and data source;
- a quick chart for one metric;
- manual entry for users with permission.
Agricultural production data analysis
Gros.farm brings together manual measurements, sensor data, weather services, and calculated metrics. Compare actuals with tech-card targets, investigate deviations, and see which production events preceded a change.
Two ways to work with production data
These are connected but distinct workspaces. Daily checks should not require a complex report, and investigating a deviation should not be limited to one current-value card.
Important: a metric represents the production meaning of data, not a sensor name.
More than sensors
Begin with manual observations and weather data. Add sensors and calculated values later without changing the production meaning or history of the metric.
Record a measurement at the facility or assign the observation to a team member with the appropriate role.
Map an available sensor or measurement point to a production metric and the relevant zone.
Use available outdoor temperature, humidity, precipitation, wind, and light data without changing the metric workflow.
Derive metrics such as VPD, DPD, dew point, and radiation sum when the required source data is available.
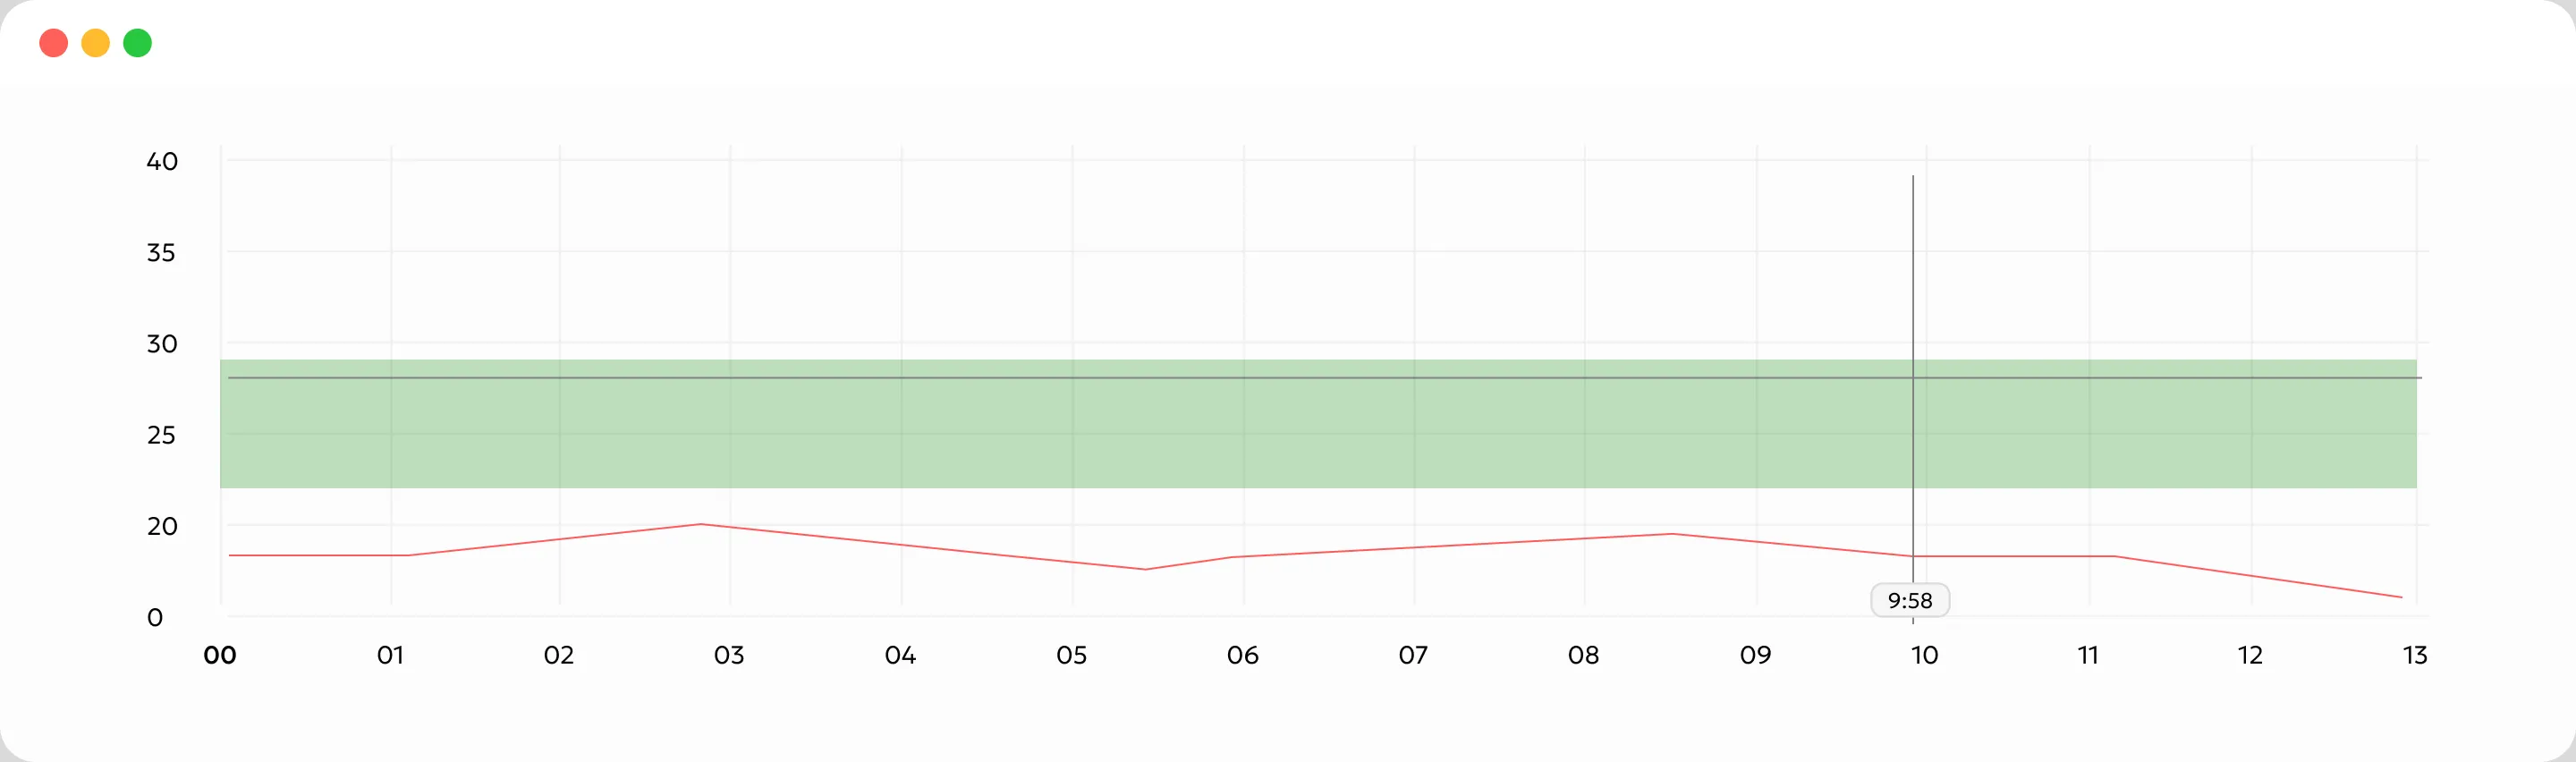
Plan and actuals on one chart
A value alone does not tell you whether conditions are appropriate. Gros.farm places it beside the target range for the current stage, with the crop, cycle, and day or night context.
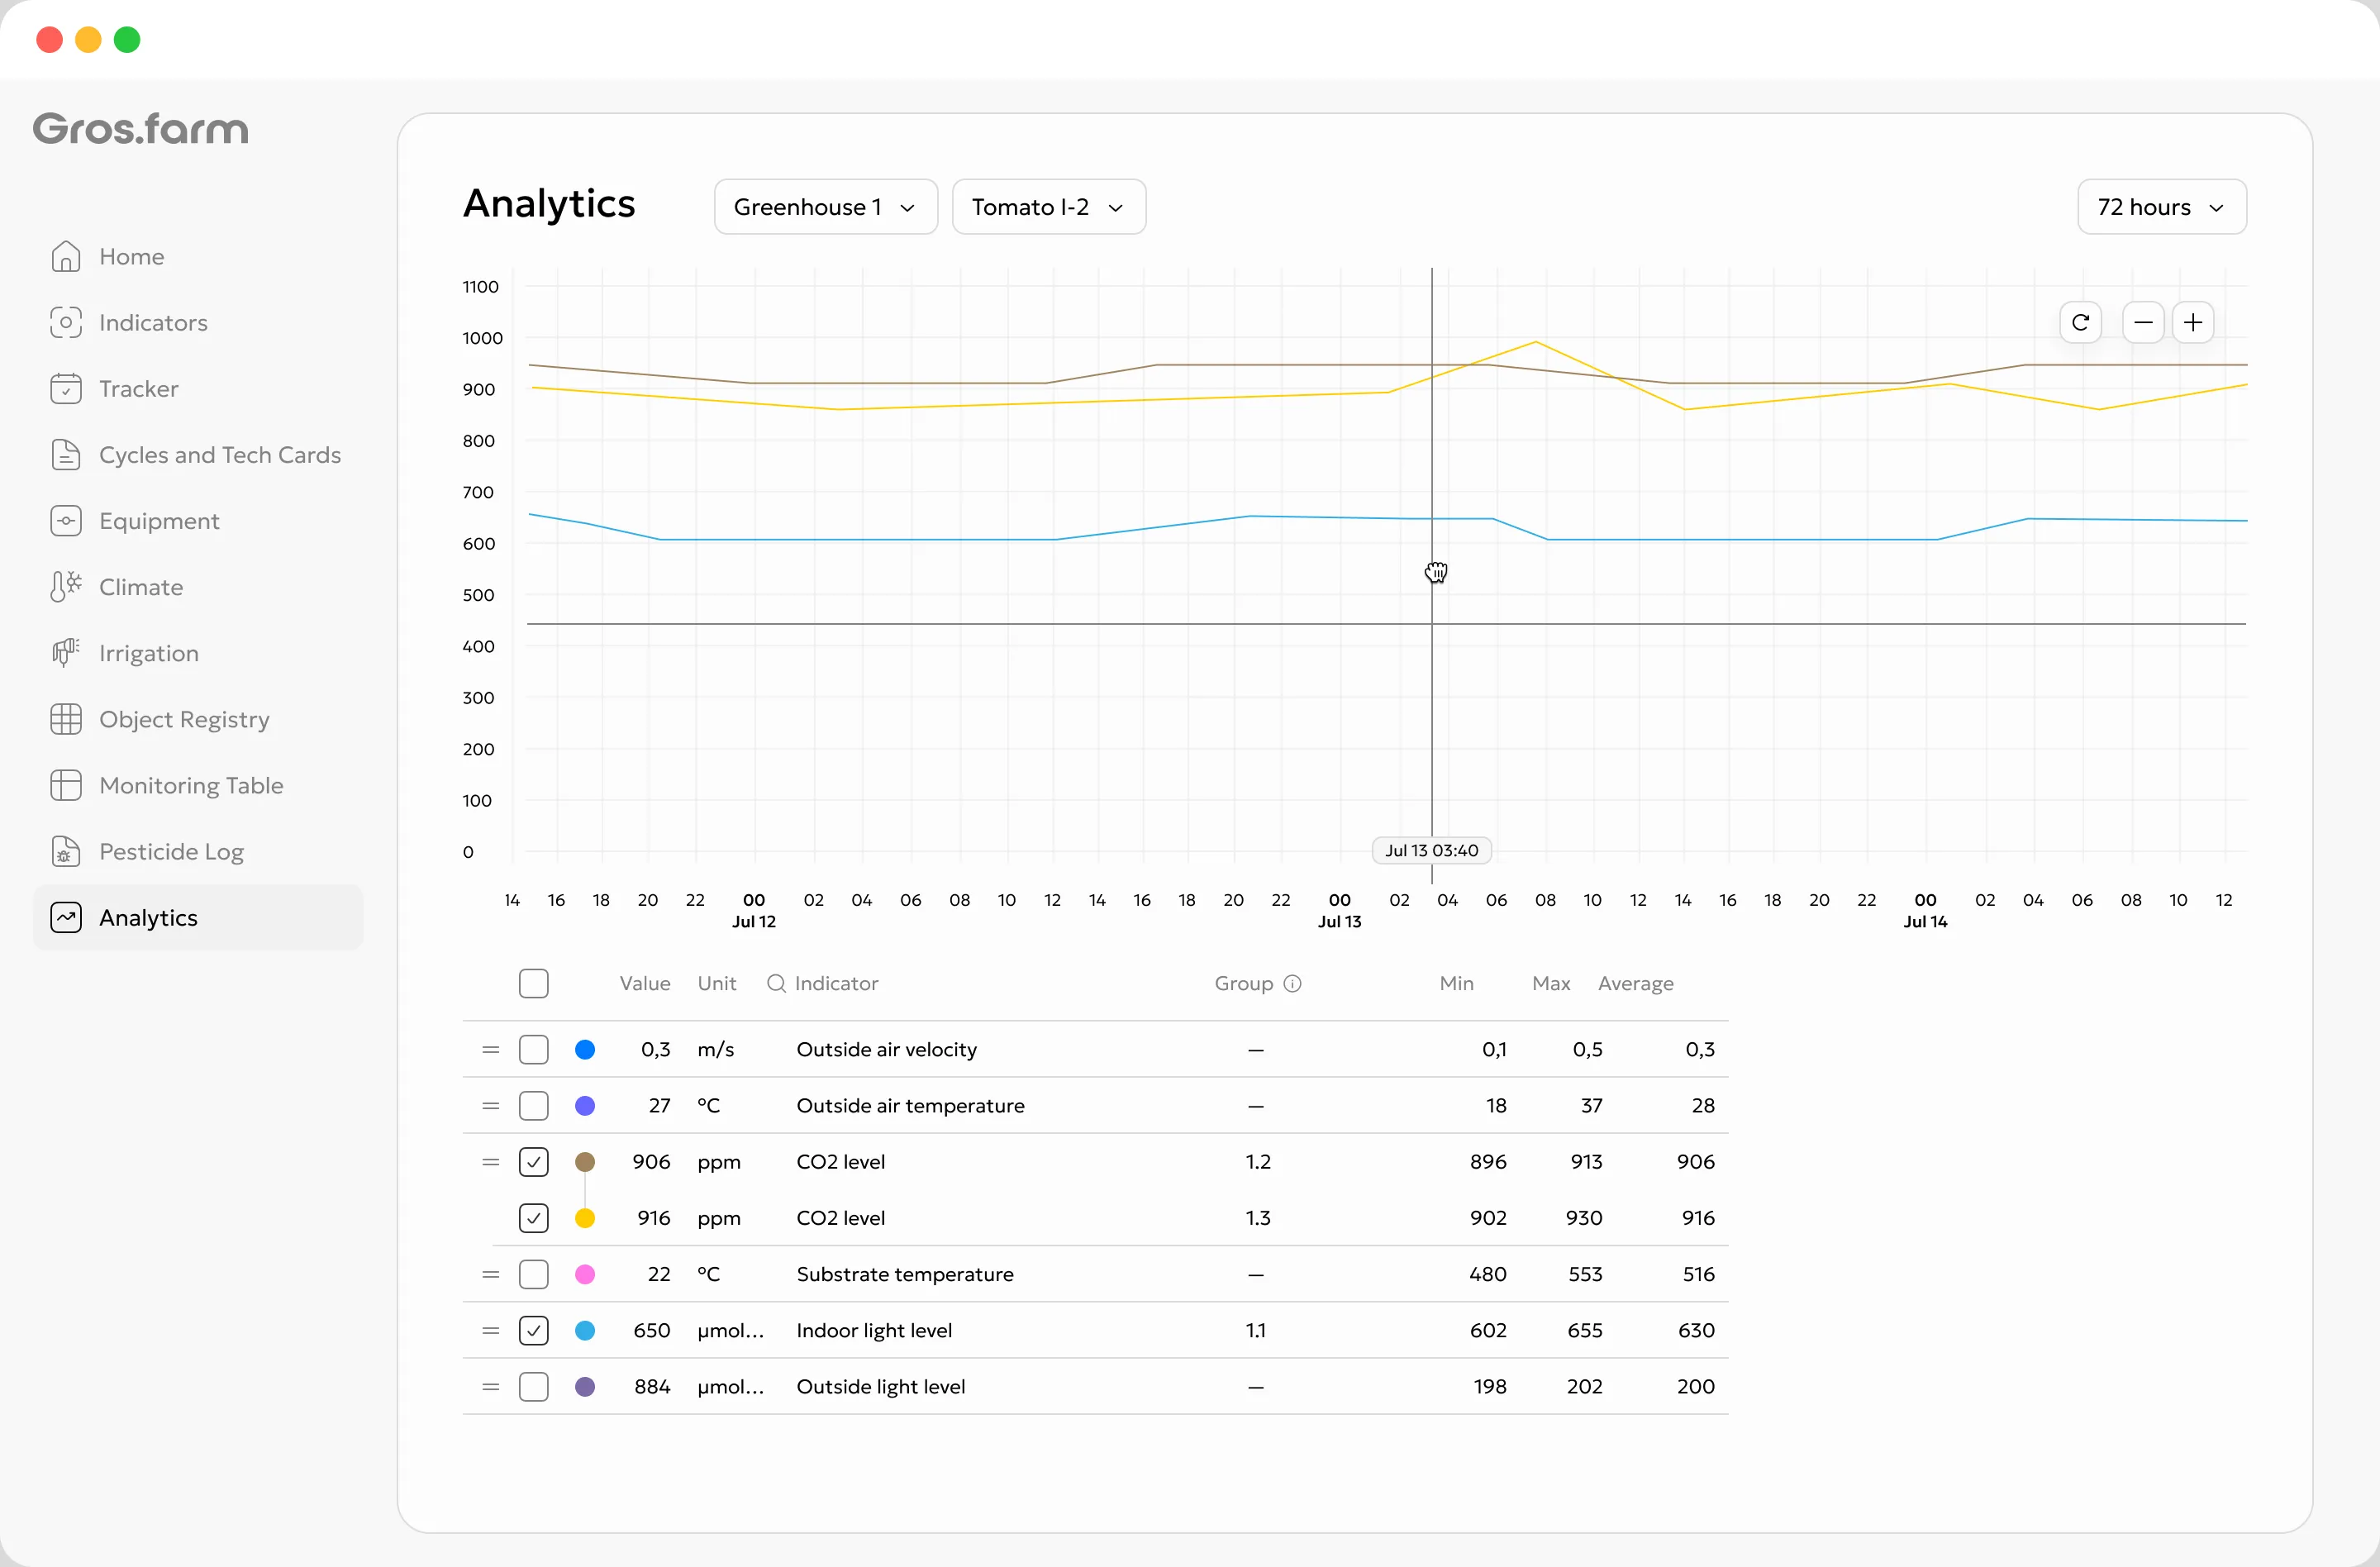
Deep analysis
Choose a facility or production zone, crop, batch, or production flow and set a period. Then enable the relevant metrics and review them on the same timeline.
Select a facility or zone, crop, batch, or production flow.
Use 12, 24, or 72 hours, 7 days, or a custom time range.
Keep only the metrics needed for the hypothesis being investigated.
Compare lines, zoom into a period, and review minimum, maximum, and average.
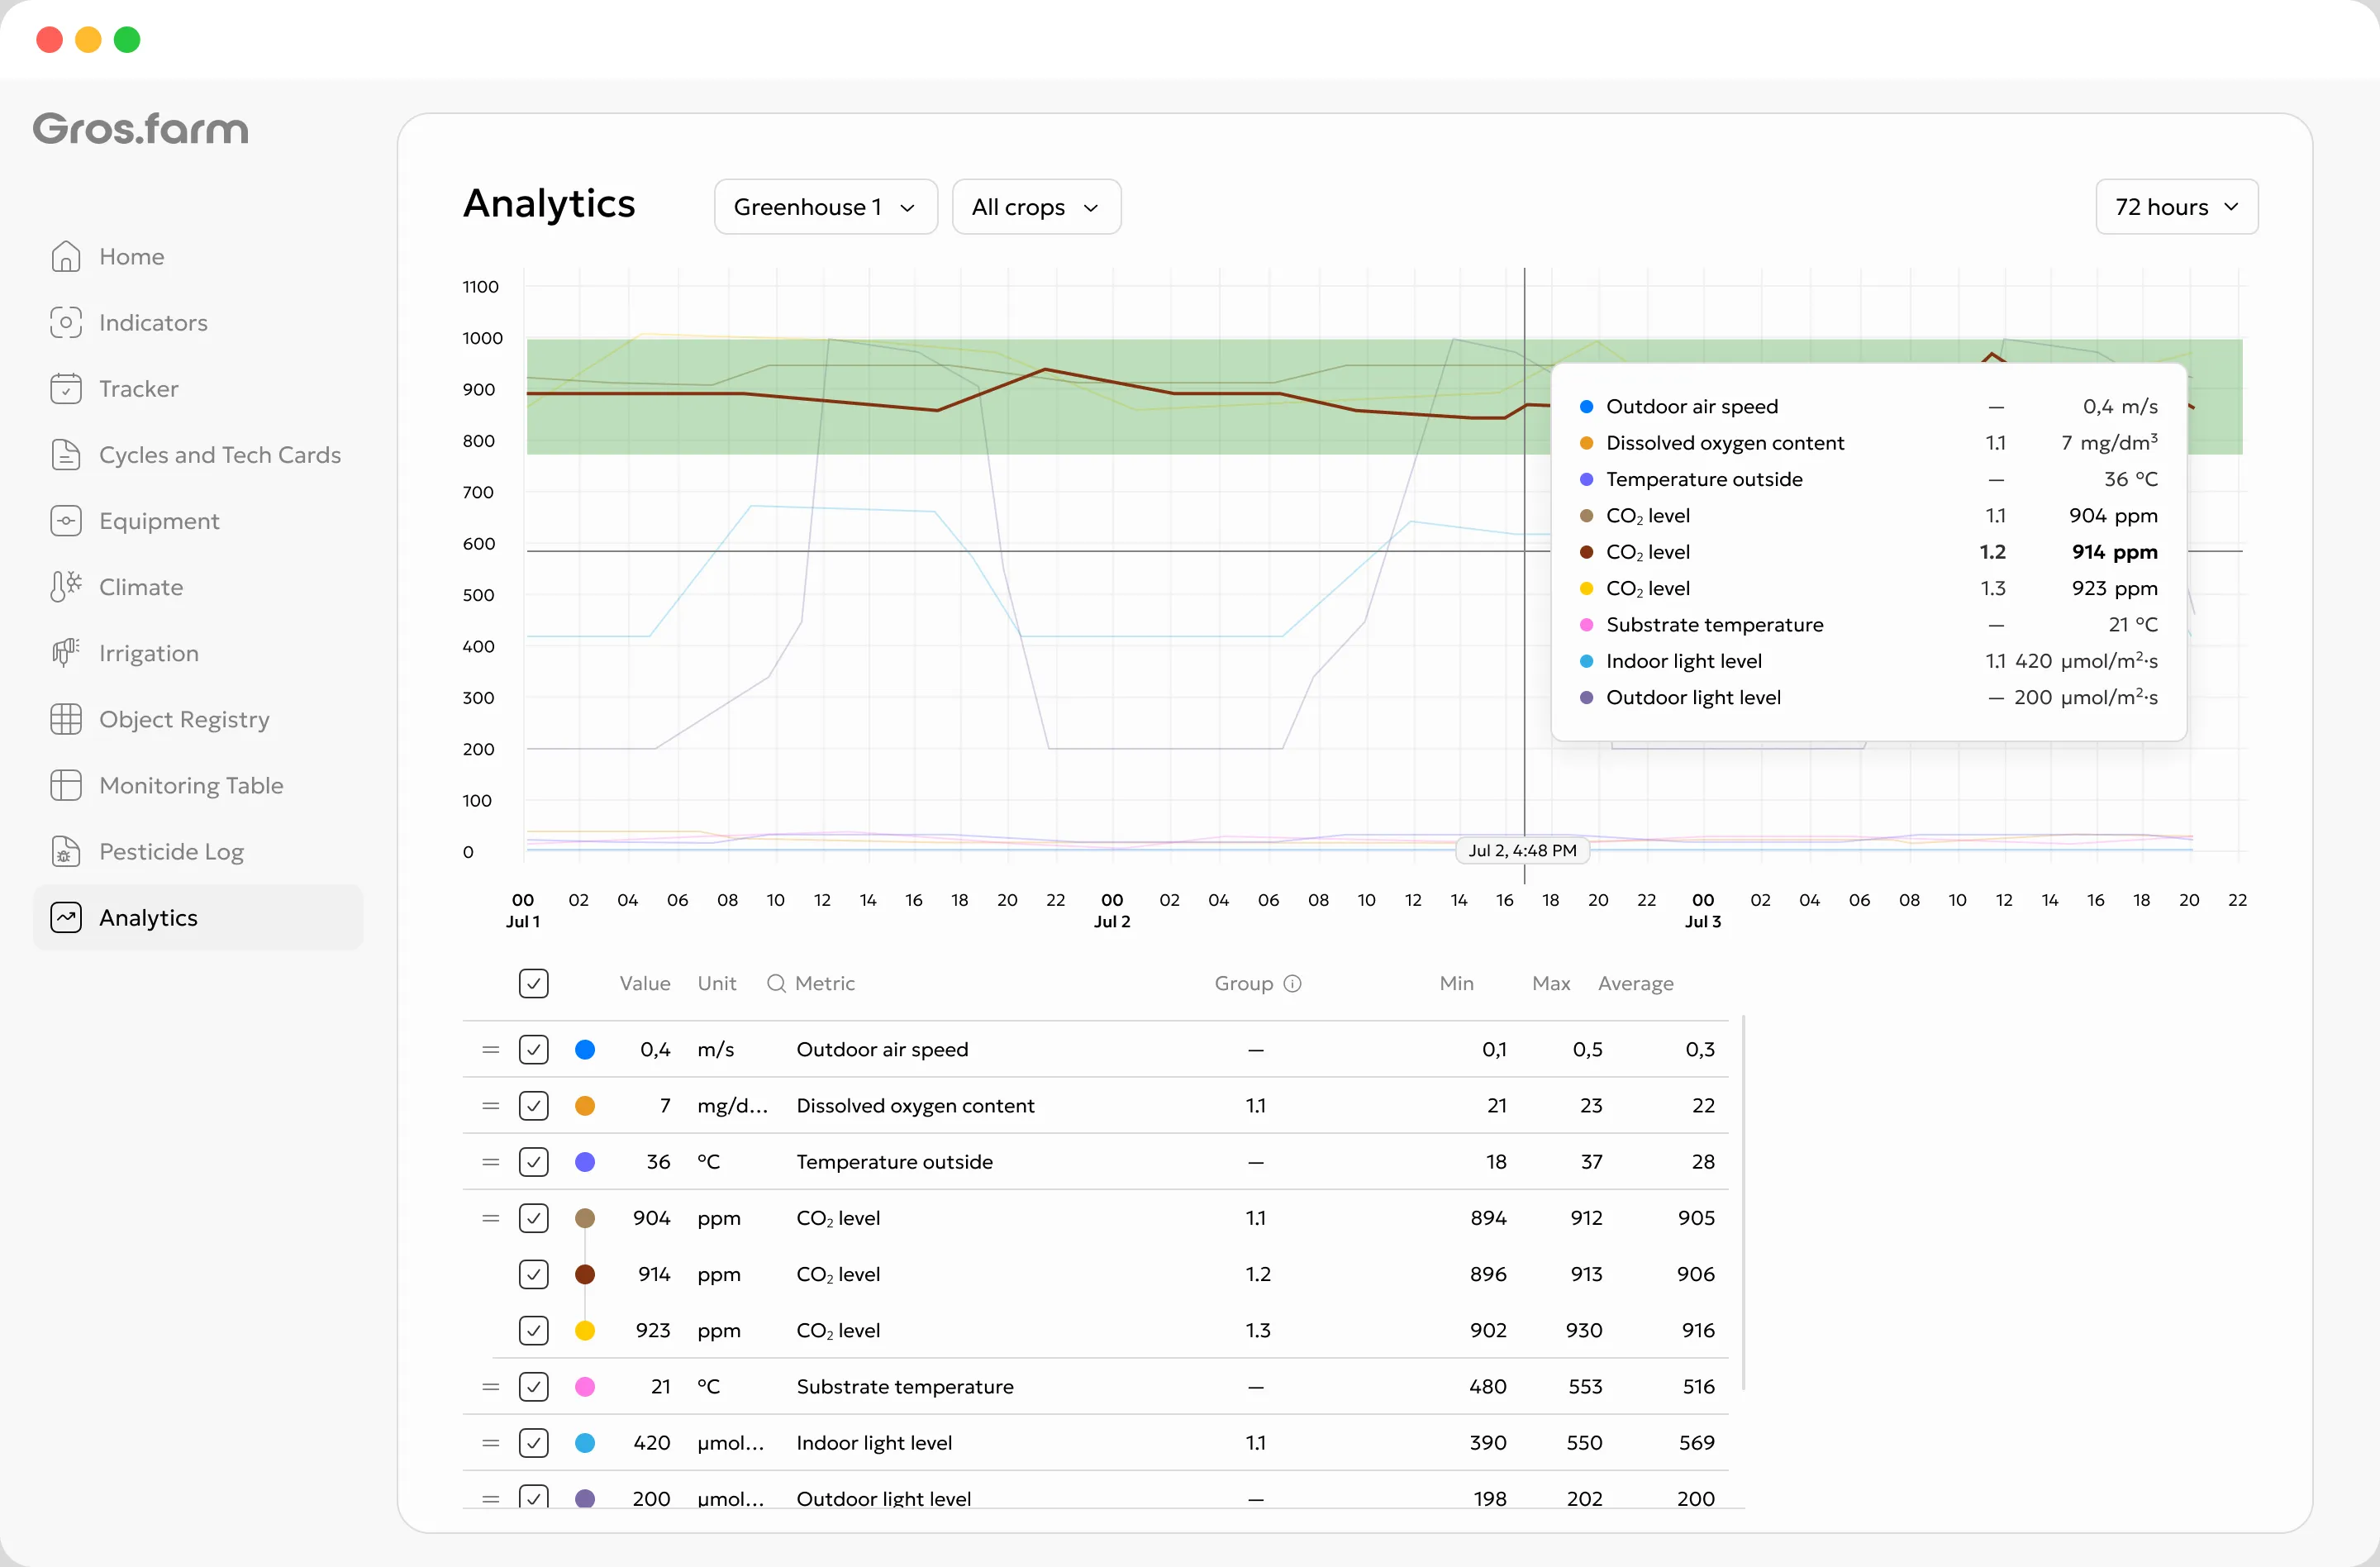
Production context for the timeline
A chart can show the moment a cycle moved to a new tech-card stage. The data change can then be reviewed alongside the change in targets and operating mode.
Review how growing conditions and actual facility behavior changed after the event.
Without an event, the chart shows a line. With an event, it gains production context.
Context for the AI workspace
A connected model can receive time series together with target ranges, stages, and events. This supports pattern exploration and helps formulate hypotheses for review.
AI can help investigate data, but it does not establish causation automatically. Decisions remain with the grower, production technologist, or other responsible specialist.
One fact base for different roles
A manager, grower, engineer, and external expert can open the same period and see the same values, targets, and events without retelling or scattered screenshots.
Compare actual conditions with stage targets and investigate production hypotheses.
Review source history and how the local control layer maintained the operating mode.
See trends and deviations across facilities without manually assembling reports.
Work from the same context as the team: data, stages, targets, and events.
Key questions
Yes. Start with manual entry and available weather data. Later, connect sensors and calculated sources to the relevant metrics without losing the production meaning or accumulated history.
Metrics is for current values, source, update time, manual entry, and a quick chart for one parameter. Analytics is for deeper comparison of several time series, periods, statistics, tech-card targets, and production events.
Yes. A production metric can have several sources or measurement points. Map each source to the relevant metric and production zone so its meaning remains clear.
The target range comes from the current stage of the tech card and can distinguish day and night requirements. The chart places the actual value beside the active target so both the size and duration of a deviation are easier to assess.
Choose 12, 24, or 72 hours, 7 days, or a custom range. Chart zoom supports closer review of a specific part of the history.
A model can compare time series, targets, stages, and events and help formulate a hypothesis. Correlation alone does not establish causation, so the responsible specialist validates the interpretation using crop biology and production context.
From values to production decisions
Begin with manual metrics and weather data, then add sensors, calculated values, and deeper analytics as the operation needs them.