Advanced Automatic Analytics

Advanced Automatic Analytics

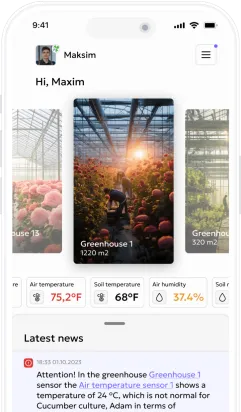
If you want access to parameter data that is automatically sent to the app 24/7 without human intervention, connect automatic sensors to Gros.farm. This can be done independently without any special knowledge.

Advanced Automatic Analytics

Very Simple Interface

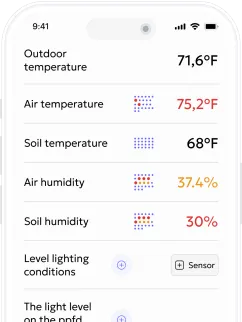
In the cultivation technological maps, there are parameters that act as rules—a data range within which values should remain. When there is a deviation from the norm, the assistant robot alerts you to the issue and highlights it with a red indicator in the parameter list and graphs. This is very simple and intuitive. Data is saved, allowing you to work with it at any time.

Very Simple Interface

Graphs Make It Convenient

The service not only collects and stores data but also visualizes it in graphs for easier analytics. You can view overall graphs for sensors of a specific type or for a particular sensor for more detailed insights. The graphs clearly show whether your values were within the normal range and when errors occurred.

Graphs Make It Convenient

Analytics and Control

You can also review analytics for a week, month, 3 months, or other time periods to understand what mistakes were made and at what stage of cultivation, to avoid them in the future. Based on data from the graphs, the system will notify you in a timely manner if the values are outside or near the edge of the norm.

Analytics and Control

Register on the Gros.farm service, download the app, and make your greenhouses smart

Point your camera and download the free app

Регистрация превьюПоказатели датчиков